2021 Week 38 - Solution

Solution by Tom Prowse and you can download the workflow here


The challenge this week took a look at what the best movie trilogies of all time were. This is off the back of Jenny's viz on Tableau Public so lets see how we can prepare the data to be visualised. 

Step 1 - Average, Highest & Rank Trilogies

Using the Films input table, we can start by calculating the average rating of each trilogy by using a FIXED LOD: 

Trilogy Average 


We can then repeat this same process to find the Max rating:

Trilogy Max 


Then finally we can rank the trilogies based on their average rating: 

Trilogy Rank


Note: There seems to be an error in the way that Prep is calculating this rank, so don't worry if your output is different!

Our table of data should now look like this: 


Step 2 - Trilogy Table

Before we combine the two tables together, we first need to remove the word 'trilogy' from each of the Trilogy field. This can be done easily by using an automatic split on the Trilogy field, removing the original Trilogy field and then renaming the split field to Trilogy. 

The table should now just be the trilogy name and ranking: 


We can now join this to our original data set by using Trilogy Rank = Trilogy Ranking:


Our joined table should look like this: 


Step 3 - Final Cleaning

There are some final clean ups that we need to do to prepare our data for the output. First we want to round the Average field to 1 decimal place: 

Trilogy Average
ROUND([Trilogy Average],1)

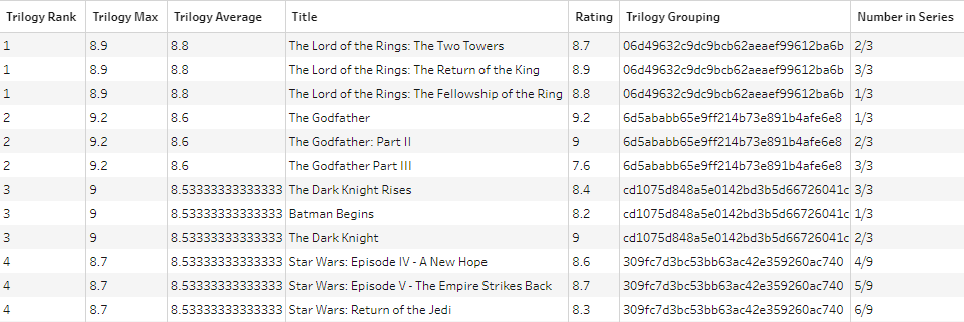
Then we can split the Number in Series field so that we have both the film order and total films in series. To do this we can again use an automatic split to split the number either side of the '/' into two separate columns.

The Split 1 field can be renamed to 'Film Order' and the Split 2 is our 'Total Films in Series' field. Finally we can remove the Number in Series field and then we are ready to output our data, which should look like this:


You can download the full output here

After you finish the challenge make sure to fill in the participation tracker, then share your solution on Twitter using #PreppinData and tagging @Datajedininja@JennyMartinDS14 & @TomProwse1

You can also post your solution on the Tableau Forum where we have a Preppin' Data community page. Post your solutions and ask questions if you need any help! 

Popular posts from this blog

2023: Week 1 The Data Source Bank

2023: Week 2 - International Bank Account Numbers

How to...Handle Free Text