2021: Week 39 - Painting Bikes
Challenge by Tom Prowse.
This week we make a return to our Bike store but this time we are looking at the painting process within the factory. The factory has a process where different bikes go through a process to be painted and the engineers are provided with some indicator values as the process progresses. It is vital that the engineers are able to track these indicators so they can keep an eye on whether the process is hitting it's target or there are any potential problems.
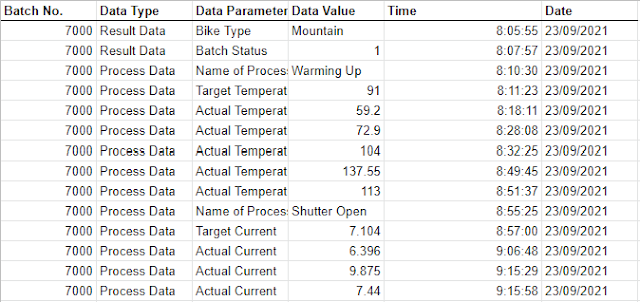
The data is currently provided in a bit of an unfriendly way with all of the parameters being in a single column. Data is also only provided when a value changes, therefore we should assume that the process value is the same as the previous value until it is updated later in the process. In order to get some value from the data set we need to change the structure and do some cleaning before we can visualise this with Tableau Desktop.
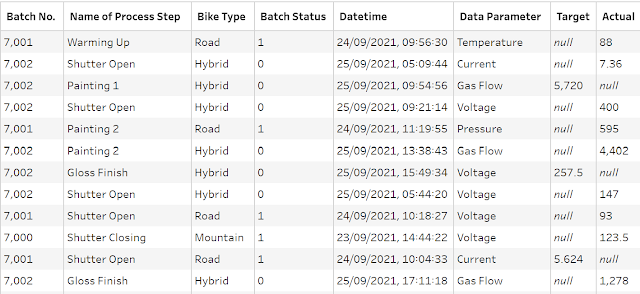
From the data set the engineers would like to have some information on the following:
- Type of bike being painted
- Status of the batch (1 = Pass or 2 = Fail)
- Actual & Target values for the following parameters:
- Current
- Voltage
- Gas Flow
- Temperature
- Pressure
- Stage of the process. These include:
- Gloss Finish
- Painting 1 & 2
- Shutter Opening & Closing
- Warming Up
- Input the Data
- Create a Datetime field
- Parse the Bike Type and Batch Status for each batch
- Parse the Actual & Target values for each parameter.
- Identify what time each of the different process stage's took place. Each process stage is provided with a start time, and there is no overlap between stages. Assume that the final process stage ends when the last update occurs.
- Output the data in a single table.


