2021: Week 43 - Solution
Solution by Tom Prowse and you can download the workflow here.

Step 1 - Date Lodged
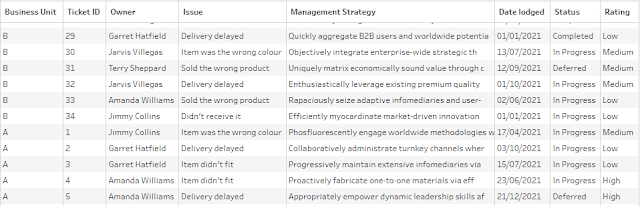
The first step is to input the Business Unit A table and create the Date Lodged field. Currently, this is split out in a Year, Month, & Day field, therefore we need to combine these into a single field using the following calculation:
Date Lodged
MAKEDATE([Year], [Month], [Date])
Now we have the new date field we can remove the Year, Month, & Day fields from the table.
Step 2 - Update Risk Rating
Next we want to use the Risk Level table to update the risk rating. We need to input the Risk Level table and then join this to our flow using Rating = Risk level, and we want to include all of the values from the Business Unit A table, therefore we'll need a Left join (or Right join depending on the order that you have joined the tables).

After the join we have some duplicated and redundant fields therefore we can remove the Risk Level and Rating fields. Our table should now look like this:

Step 3 - Combine Business Unit A & B
Next we want to include the second business unit table (Business Unit B) into our existing workflow. This table is structured in the same way therefore we want to 'stack' the tables on top of each other by using the union step.
All the fields should match up, and we can remove the Table Names field so our data looks like this:
Step 4 - Classify Cases
Now we have combined all the tables, we can start to classify the cases in relation to beginning of the quarter. We want to identify the opening cases (if they were lodged before the beginning of the quarter) and the new cases (cases lodged after the beginning of the quarter).
The first step is to identify the beginning of the quarter by truncating each of our dates to a quarter level. For this example we are going to base this on 'today' as 27th October, but in a real-life example you would probably use the today() function:
Beginning of Quarter
DATETRUNC('quarter', #2021-10-27#)
Next we can identify whether each case occurred before or after this date using the following calculations:
Opening Cases
IF [Date lodged] < [Beginning of quarter] THEN 1 END
New Cases
IF [Date lodged] >= [Beginning of quarter] THEN 1 END
Then we can also identify any cases that were closed or deferred within the quarter by using these calculations:
Deferred
IF [Status] = "Deferred" THEN 1 END
Completed
IF [Status] = "Completed" THEN 1 END
Our table now looks like this with the extra fields:

The last part of this step is to count how many cases are in each of the classifications. We do this by using an aggregation step to group by Rating and then sum the 4 fields that we have just calculated:

Step 5 - Continuing Cases
The last step this week is to calculate the cases that are being carried over the the next quarter. First we need to ensure that all of the null values are actually 0s, therefore we can use the ZN() function on the Deferred field to turn the nulls into a 0.
Then we can calculate the continuing total with the following calculation:
Continuing
[Opening cases] + [New cases] - [Completed] - [Deferred]

Our table currently has all of the totals in a separate column, however for our analysis we want these to be in a single column, therefore we need to use the columns to rows pivot with each of the total fields:

After a couple of final field name changes, our data is ready for our output:

After you finish the challenge make sure to fill in the participation tracker, then share your solution on Twitter using #PreppinData and tagging @Datajedininja, @JennyMartinDS14 & @TomProwse1
You can also post your solution on the Tableau Forum where we have a Preppin' Data community page. Post your solutions and ask questions if you need any help!


