2021: Week 45 - Solution
Solution by Tom Prowse and you can download the workflow here.

It was Tableau Conference week so it was time for a themed challenge, and this year we focused on Braindates! With lots of knowledge sharing happening between different meetings, we wanted to know how many people will you indirectly gain knowledge from as you attend brain dates?
Step 1 - Session DateTime
The first step is to input our data for each of the Brain Date sessions. This is in the form of 3 separate worksheets (one for each day of the conference) and they are all structured in the same way, with the same fields.
Instead of bringing each of the three session sheets in as separate inputs, we can use the Wildcard Union within the input tool to bring in all three sheets. Using the matching pattern of '*Nov' will bring in any sheet with the word Nov at the end.

Once we have input the data we can start to create a datetime for each of the sessions. The time of the session is included in the original worksheets, and we can then use the Table Names that have been created by the Union to parse the date of the session.
First we need to split the Table Names field so that we have the day number and the month in separate fields. We can do this by using a Custom Split with a ' ' (space) as the separator. As a result we have two new fields (Day & Month).
The Day field will still have the day suffix, therefore we can use the 'Remove Letters' cleaning functionality, and then change the data type to a whole number.

Next, we are ready to focus on the time of each of the sessions. This is in a decimal format and that isn't quite what we want to create our time field. Therefore, we again need to split the Session Time into an Hour and Min field by using the ':' as the separator.
Now we have the separated fields, we can change them both to be a Whole Number and then replace any blank/empty values with a 0. This can be done by double clicking on the value within the profile pane and replacing with a 0.
We should now have 4 separate fields that we can use to create our datetime field:

The calculation to create the date is the following:
DateTime
MAKEDATETIME(
MAKEDATE(2021,MONTH(DATEPARSE('MMM',[Table Names - Split 2])),[Table Names - Split 1])
,
MAKETIME([Session Time - Split 1],[Session Time - Split 2],0)
)
Within the calculation we are using both the MakeDate and MakeTime within a MakeDateTime function to ensure that the datetime field is in the correct format. Also, using a dateparse on the month field will allow us to convert the month string in the numeric value.
After removing the unneeded fields the table should now look like this:

Step 2 - Join Attendees
Next we want to bring in the attendee names from the Attendees sheet in the input. Before we join the tables we need to make some changes to our existing workflow so that we have a row for each attendee id as currently they are concatenated within a single field.
First we want to split out each of the ids into their own field by using a split on the ',' field (this can be done using an automatic split). Once we have the 5 new columns, we can then use a Columns to Rows pivot to bring them into a single column.
The pivot can be set up using the wildcard functionality by bring all fields that have 'Split' in them:

After the pivot we can remove any 'Null' values and change the Attendee ID Split field to be a whole number.

Now we have a separate row for each attendee id, we can now join the Attendees table onto the existing workflow by using an inner join on Attendee ID

At this stage our data should look like this:

Step 3 - Direct or Indirect?
Next is to classify whether the interactions with each person is direct (within the same session) or indirect (someone who was in a previous session with someone that you have met). To classify each of these we are going to use some self-joins to help match up the corresponding attendees.
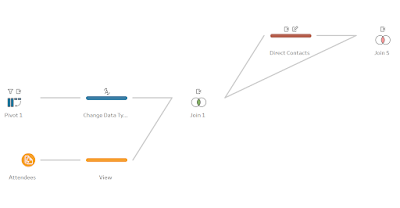
First lets focus on the Direct contacts, we can create a new step and then remove the Date and Subject fields so we are just left with the Session ID and Attendee Name (Direct Contact). From here we can join this back to our original workflow (from the previous join where we joined the attendees list) using the Session ID field.
The join condition is an inner join on Session ID and notice how this 'explodes' our data and matches everyone in each of the sessions.

We now have a row for each Attendee and each of the different contacts they met within each of the sessions. We also have a row where the attendee and the direct contact is the same person, therefore we can use a filter [Attendee]!=[Direct Contact]to remove these.
As a result our data should now look like this:

Now we want to do the Indirect Contacts. These are defined as being a direct contact for each of the attendees direct contacts, from the sessions that have happened prior to meeting.
We are going to use a similar technique to classify these, so first we need to create a new step and rename some fields so that it is easier to identify the correct fields after the join. We are going to rename the following:
- Direct Contact to Indirect Contact
- Attendee to Direct Contact
- DateTime to DC DateTime
- Direct Contact = Direct Contact (this will match the direct contacts who have met with each other)
- Subject = Subject (this ensures that they have spoken about the same subject)
- DateTime >= DC DateTime (this returns only sessions that have happened previously)


After removing some unneeded fields our table should now look like this:

Step 4 - Reshape for Output


