2021: Week 46 - Solution
Solution by Tom Prowse and you can download the full workflow here.

This week we turned our focus onto the Tableau Desktop relationship model and how we can build the physical layer of the data model using various aggregated and conditional joins. We are using the classic example of the Bookshop so let's look how we can solve the challenge!
Step 1 - Sales Data
The first step is to bring all of the sales data into the workflow. This is split into 4 separate sheets (1 for each quarter) therefore we can use a 'Wildcard Union', within the input step, to bring all 4 sheets in together.
To make sure we are bringing in the correct sheets, we can use the matching pattern of 'Sales Q*' to make sure we are bring in the 4 different sales sheets.

From here we can then remove the File Path & Table Names fields that have been auto generated after the union. At this stage we should have 56,350 rows, and this number should be replicated throughout the challenge.
Step 2 - Join 'Single' Tables
The task includes lots of joins but first we are going to start with joining the tables that don't require any aggregations or different conditions. These are going to be the tables that join easily to our original sales table.
We can use the following steps to join the tables:
- Edition table using the ISBN field
- Book table using the BookID field
- Publisher table using the PubID field
- Author table using the AuthID field
At this stage we can remove any duplicated fields that have been created as a result of the join and our workflow should look like this:

Then finally we have the Info table to join, but first we need to concatenate the two separate BookID fields (BookID1 & BookID2) to make a single field so that it matches the same pattern as in the other tables.
To concatenate the fields we can use the following calculation:
BookID
[BookID1]+[BookID2]
This is what our workflow should look like after doing the standard joins

Step 3 - Aggregate Joins
Next up is the aggregate joins, so this is where the relationship model within Tableau Desktop allows you to avoid duplication caused by the one to many relationship.
Checkouts
Within the Checkouts table we want to calculate the Total Checkouts and Number of Months that the book has been checked out. For this we can use an aggregate tool where we Group By BookID, then Sum Number of Checkouts and Count CheckoutMonth.

Then we can join this newly aggregated table to our workflow using BookID field.
Ratings
Now we can do a similar technique to find how many Reviewers, Reviews and the Average Rating. For this we again want to use an aggregation tool where we Group By BookID, then CountD ReviewerID (Number of Reviewers), CountD ReviewID (Number of Reviews), and Avg Rating (Average Rating).

Again we can then join this to our workflow using the BookID.
At this stage we can clean up the workflow a little bit by ensuring that all of the aggregated fields have been named correctly and any duplicate fields have been removed.
This part of the workflow look like this:

Step 4 - Conditional Joins
The final tables require a slightly different type of join to ensure that we retain the correct number of rows within our data set. These tables don't contain all of the books in our workflow therefore we need to use Left or Right joins to make sure that we include all of the Sales rows.
Series
The Series table is joined via the SeriesID field, however not every book is part of a Series meaning that some of the Sales rows are removed. To overcome this we need to use a Left (or Right depending on your setup) to ensure that we are returning all rows from our workflow and the rows that match from the Series table.

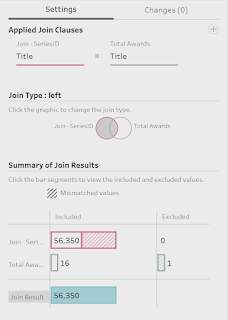
Award
This is the final table that we need to join and it contains both an Aggregate and Condition join. First we need to aggregate to find the total number of awards for each book by Grouping By Title then CountD Award Name.

From here we can then join this onto our workflow, using the Title field, but again we need to ensure that this is a left/right join as not all books have won an award.
The final step is to clean up any fields that have been duplicated and ensure that all of the aggregated fields are named correctly.
The output should include 38 Fields (calculations / aggregations in Italics):
- Book ID
- Sales Date
- ISBN
- Discount
- Item ID
- Order ID
- First Name
- Last Name
- Birthday
- Country of Residence
- Hrs Writing per Day
- Title
- Auth ID
- Format
- PubID
- Publication Date
- Pages
- Print Run Size (k)
- Price
- Publishing House
- City
- State
- Country
- Year Established
- Marketing Spend
- Number of Awards
- Number of Months Checked Out
- Total Checkouts
- Genre
- SeriesID
- Volume Number
- Staff Comment
- Series Name
- Planned Volumes
- Book Tour Events
- Average Rating
- Number of Reviewers
- Number of Reviews
56,350 rows (56,351 rows including headers)
You can download the full output here.
After you finish the challenge make sure to fill in the participation tracker, then share your solution on Twitter using #PreppinData and tagging @Datajedininja, @JennyMartinDS14 & @TomProwse1
You can also post your solution on the Tableau Forum where we have a Preppin' Data community page. Post your solutions and ask questions if you need any help!


