2021: Week 47 - Solution
Solution by Tom Prowse and you can download the workflow here. Also, Will has provided the solution in R which can be downloaded here.

The challenge this week was a cross-over with the new community project #GamesNightViz and #PreppinData regular Will Sutton. The challenge was to recreate a Pizza chart all about the top female poker players across the world.
Step 1 - Combine Players & Events
The first step is bring both of the tables in our input into the workflow. From here we can then use a join to combine them together.
The join condition is where player_id = player_id:

We can then tidy up the table be replacing any nulls in the 'prize_usd' field with a 0 and also calculating the number of wins for each player using:
Wins
IF [player_place]='1st'
THEN 1
ELSE 0
END
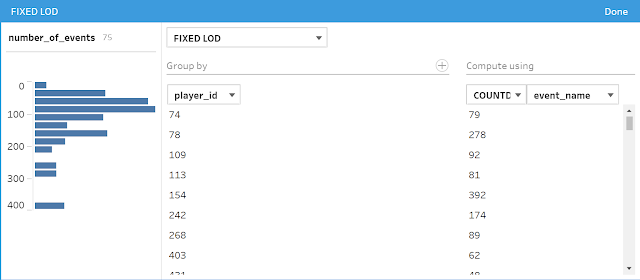
Then finally we want to know how many events each player attended so we can calculate this using a FixedLOD calculation, where we group by 'player_id' and then CountD 'Event Name':
number_of_events

Step 2 - Career Details
The next part of the challenge is all about the career of each player, so first we want to know how long their career has been. To calculate this we need to find out when the first and last event was and then find the difference between the two dates.
First Event


Career Length
DATEDIFF('day',[First Event],[Last Event])
/
365
We calculate it in days first then divide by 365 as we want to know the years with decimals!
Step 3 - Player Stats
Next we want to find out some information about the players career stats so first we need to know what their biggest win was by calculating the max 'all time money usd':

Now we have calculated the biggest win, we can aggregate the rows to calculate the stats as required from the requirements document.
The aggregation is:
Group By
- Name
- Biggest Win
- Number of Events
- Career Length
- Sum 'wins'
- Sum 'all time money usd'
- Countd 'event country'

Finally we need to calculate the win %:
Win %
[Wins]
/
[number_of_events]
Then rename some fields so that they match the output
- 'all time prize money usd' to 'total prize money'
- 'event country' to 'countries visited'

Step 4 - Pizza Chart
The final part of the challenge is to prepare the data so that it's ready to create a Pizza chart in Tableau. The first step is to pivot the data so that all of our stats columns become rows (this is all our fields apart from name):

So now we have each players name with their stats and the raw values in the 3 fields:

The final part of the challenge this week is probably the trickiest part. This is where we calculate the ranking using a method that averages ties, and this isn't a standard method of calculating ranks within Tableau Prep.
First we want to calculate the 'normal' rank for each metric:
Rank

Next we want to calculate the 'modified' rank, which isn't available within the visual calculation, however we can write this out in a traditional calculation using:
Modified Rank
{ PARTITION [metric]: { ORDERBY [raw_value] asc : RANK_MODIFIED()}}
We can now use these two ranking values to calculate the scaled value (or the average if there's a tie) by finding the average between the two values:
Scaled Rank
([Rank]+[Modified Rank])
/
2
After removing the other rank fields, we are now ready to output our data which should look like this:

You can download the full output here.
As a bonus you can also create the pizza chart within Tableau by using the links from the requirements document!


