2021: Week 49 - Solution
Solution by Tom Prowse and you can download the workflow here.

The next instalment of our Departmental December challenges is all focused on Human Resources! We look at data related to our sales team and how long they have been with the company and how much that has cost us.
Step 1 - Employment Range


Next we want to duplicate each of the newly calculated fields, so that we can convert them to the Month Name and Year number. We duplicate the fields so that we can use the in-built Tableau Prep functionality to convert these.
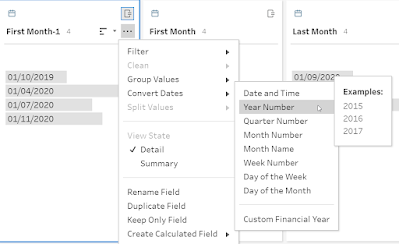
Once we have converted the Months and Years for each the First and Last date then our data should look like this:

We now have each of the individual parts therefore we can bring these together to make the desired string using the following calculation:
Employment Range
LEFT([First Month-1],3)+' '+STR([First Month])+' to '+LEFT([Last Month-1],3)+' '+STR([Last Month])
The last step is to create the Reporting Year field, so we can duplicate the date and again use the convert date functionality to convert the date to a year, which we'll call Reporting Year.
Then we can remove the unneeded fields so that we are left with the following table:

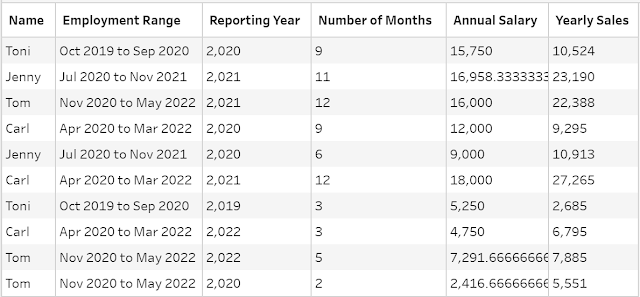
Step 2 - Yearly Totals
- Number of months they worked
- Their salary they will have received
- Their sales total for the year

Our data now looks like this:
Step 3 - Tenure
Within this step we are going to calculate a running total of the months that an employee has worked for us. To do this we are going to use a self-join technique where first we need to create a new step and keep only the Name and Reporting Year fields. These are going to be the fields that are important within the join.
Using the new step, we want to join this back to our original data and join on Name = Name and Reporting Year >= Reporting Year.
We use the Reporting Year join to help accumulate all of the additional months so that we can then use this to calculate the running total for tenure.
From here we can use an aggregation tool to calculate the Tenure field, where we group by Name and Reporting Year, then Sum the Number of Months:


If we go back to the step before we calculated the tenure, we can create a new step where we want to remove the Number of Months field. After this step we can then join back to our existing workflow using the Name and Reporting Year fields. This will bring back the additional details about each of the employees whilst also maintaining the Tenure field.
The data looks like this:

Step 4 - Bonus Payments
Then the final steps are to tidy up a couple of the Salary fields. We want to do the following:
- Rename Annual Salary to Salary Paid
- Round Salary Paid to 2dp - ROUND([Salary Paid],2)
- Calculate the total paid using - ROUND([Salary Paid]+[Yearly Bonus],0)
That is the finally steps needed for the challenge this week so the output should look like this:


