2021: Week 48 - Solution
Solution by Tom Prowse and you can download the workflow here.

This was the first challenge in our 'Departmental December' month where we are going to focus on a different business department - starting with Finance!
The challenge had a 'nicely' formatted spreadsheet and we wanted to compare the different sales for each of our branches across different years. This input may look nice on a spreadsheet, however when we input this into Tableau Prep it doesn't look so nice.
Step 1 - Branch Sales
The first step is to bring in our input and then combine each of the different tables for each of the branches. When initially bringing this into Tableau Prep, all the tables are onto top of each other and aren't easy to work with, so to overcome this we need to use the 'Data Interpreter'. Using the Data Interpreter, Tableau Prep automatically identifies each of the three tables, and creates a separate input for each of them.

Each of these inputs are a different Branch, therefore we can combine these using a union tool to get a nicely formatted table to start our analysis.

Step 2: Pivot Branch & Years
The next step is to transform our table so that we have the branches and years in rows instead of separate columns. For this we can separate our workflow into two separate streams (Branches & Years).
Branches
First we are going to create a pivot step, from the union tool, and use a columns to rows for each of the different branches (Wimbledon, Lewisham, and York).

Then finally we can remove any null values from the Pivot1 Values field. Our table should look like this:

Years
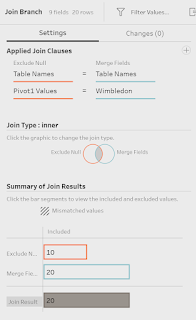
We're going to create another pivot tool, on a separate branch, but this time we are going to bring both of the Year values. You can use the wildcard pivot with the term 'Year':

As a result of the pivot, we are left with the three branches in their individual fields but with lots of nulls. To overcome this we can merge these fields together by dragging one field on top of another until we have a single field left. In our case it is Wimbledon, but it could be any of the three branches.

Our table now looks like this:

Step 3 - Prepare for Output
The final steps this week are to follow the requirements and clean up the table so that it matches the output.
First we want to transform the values into their 'True Value' by adding the necessary 0's.
True Value
IF CONTAINS([Wimbledon],'(k)') THEN [Year]*1000
ELSEIF CONTAINS([Wimbledon],'(m)') THEN [Year]*1000000
ELSE [Year]
END
Check out Mo. Hassn's solution where he used the POWER() function to do this!
Next up we need to remove the k/m suffix from each of our measures using the following calculation:
Measure Name
IF CONTAINS([Wimbledon],'(k)') THEN REPLACE([Wimbledon],' (k)','')
ELSEIF CONTAINS([Wimbledon],'(m)') THEN
REPLACE([Wimbledon],' (m)','')
ELSE [Wimbledon]
END
Then finally we can remove the 'Year' part from each of our sales years. To do this we can use a Replace() function:
Recorded Year
INT(REPLACE([Pivot1 Names-1],'Year ',''))
Finally (if we're following the no renaming of fields rule), we can create a calculated field to rename our Pivot1 Names field. This is going to be our Branch, therefore we can create a calculated field with just the Pivot1 Names field in it.
Just before we output our data we need to remove any unneeded fields and then we're ready to go! The output should look like this:

You can download the full output here.
After you finish the challenge make sure to fill in the participation tracker, then share your solution on Twitter using #PreppinData and tagging @Datajedininja, @JennyMartinDS14 & @TomProwse1
You can also post your solution on the Tableau Forum where we have a Preppin' Data community page. Post your solutions and ask questions if you need any help!


