2022: Week 3 - Solution
Solution by Tom Prowse and you can download the workflow here.

It's week 3 of our introductory month and this week we are introducing some aggregation and joins! These are pretty fundamental data prep techniques so should be useful and very familiar as you continue on your data prep journey.
Step 1 - Input Data
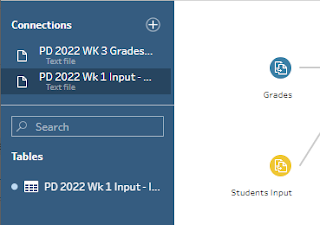
The first step is to add in our data table, however this week we have two of these instead of just the single table that we had in the previous two weeks.
Therefore, we need to repeat the process for both tables by connecting to both tables and then dragging each of them onto the canvas. At this stage we should have two input steps, 1 for Grades and 1 for Students.
Step 2 - Join Tables
Now we have both of the tables in the workflow, we need to combine these so that we can use the data from both tables in our workflow. To combine these we are going to use an inner join.
The inner join will match the key values that appear in each of the tables and then combine the rows of data. In our case we are going to join where the Student ID (from the Grades table) matches the id (from the Students table).
The join condition looks like this:

Notice how we have 1,000 rows in each table, and then after the join we have maintained 1,000 rows therefore we would expect that all of our rows have matched up.
After the join we can tidy up the table slightly by removing the id field and also any fields related to the parental names.
Our table should now look like this:

Step 3 - Pivot Data
Next we need to create a row for each student and subject that they have studied. Currently, we have each of the subjects in a separate column, therefore we need to pivot this using a Columns to Rows pivot.
We can create a pivot step, and then drag each of the subjects into the Pivoted Fields section of the pivot.

As a result of the pivot we now have two new fields named Pivot Names1 and Pivot Values1. We want to rename these to Subject and Score so that our data should look like this:

Notice how the table structure has gone from wide to a thin, long table. This is normally more optimal when using within Tableau Desktop.
Step 4 - Passed Subjects?
The next step is to calculate whether or not the student passed their subject or not. The pass mark is anything 75 and above, therefore we can use the calculation to return a 1 for pass or 0 for fail:
Passed Subject
IF [Score] >= 75 THEN 1 ELSE 0 END
This now shows a 1 or 0 based on the 75 pass rate mark. As you can see we now have a 1 or 0 for each row of data:

Step 5 - Average Scores
Within this next step we are going to introduce an aggregation step. This will allow us to aggregate our data and calculate how many subjects each student has passed and their average score.
In the aggregate setup we want to group by Student ID and Gender (as we want a row for each) and then calculate the avg Score and sum Subject Passed:

As a result we now only have the 4 fields which look like this:

Step 6 - Final Clean
The last step this week is to rename some fields to match the output and also round the Avg Score to 1 decimal places using the following calculation:
Student's Avg Score
ROUND([Score],1)
We are now ready to output our data in the desired format:

You can download the full outputs here.
After you finish the challenge make sure to fill in the participation tracker, then share your solution on Twitter using #PreppinData and tagging @Datajedininja, @JennyMartinDS14 & @TomProwse1
You can also post your solution on the Tableau Forum where we have a Preppin' Data community page. Post your solutions and ask questions if you need any help!


