This week we take a look at something a little different compared to The Prep School challenges. This challenge is a bit of fun and we look at the likelihood of scoring big with a 7 letter word in Scrabble.
Step 1 - Input Scrabble Scores
The first table to focus on is the Scrabble Scores sheet. This contains all the information about the scores and tiles within a game of Scrabble. However, all of this information is within the same field therefore we need to split this out so that we have three individual fields instead.
To do this we can use the custom split functionality to first extract the Points. We could do a split on the ':' symbol, however to make things a little easier we can just return anything before the first occurrence of the word 'points:':
We can then make this a whole number and rename to Points.
Next is the tile and frequency information. This is a little harder but we want to use a custom split again, but this time return everything after the ':' symbol.
This has the opposite effect compared to the last split, as it removes the Points information and leaves the rest of the string.
From here we can parse the each of the letters out by using another split, but this time splitting all values by a ',':
At this stage we should now have 10 different split fields with a range of different letters and their frequency.
Now to make our lives easier, and so that we don't have to go and create a split on each of these fields, we can pivot the data so that all of the split fields are in a single column. Here you can use the wildcard columns to rows pivot, by using 'Split' in the wildcard search:
Now they are in a single column, we need to make sure that we remove any spaces so that we can then split by the 'x' value. This time the automatic split should work and we should be left with two new fields - Tile and Frequency.
Our table should now look like this:
Step 2 - % Chance of Drawing a Tile
Next, calculate the % chance of drawing a particular tile by using the calculation Frequency / Total Number of Tiles.
First, we need to calculate the total number of tiles by using a LOD calculation:
Total Tiles
Then we can use that to calculate the % Chance, rounded to 2 decimal places:
% Chance
ROUND([Frequency]/[Total Tiles],2)
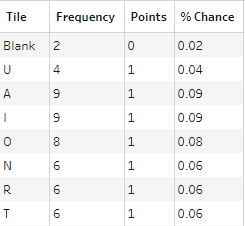
After these calculations our table should look like this:
Step 3 - 7 Letter Words Input
Now it's time to turn our attention to the 7 letter words table in our input. After inputting the table into our workflow, the first calculation we need to make is to calculate the length of each word using the Len function:
Length
LEN([7 letter word])
From here we want to split out each of the letters into a separate fields. Unfortunately, you can't do this natively with Tableau Prep, therefore we need to include our scaffold to help us out.
After inputting the scaffold table, we can then join this onto the 7 letter words table using Length >= Scaffold:
This will allow us to have each word repeated from 1-7 (7 rows). Therefore, we can now use the Mid function to extract each of our letters based on it's position and the scaffold value that we have just joined on. Eg, 1 from the Scaffold will be letter 1, 2 from Scaffold letter 2, etc.
Letter MID([7 letter word],[Scaffold],1)
After this calculation our table should look like this:
From here, we can now count how many occurrences each letter has in each word. Within the aggregation we want to Group By 7 Letter Word & Letter, then Sum Number of Rows:
After the aggregation our table should look like this:
Step 4 - Combine Workflow Branches
Now we've prepared both tables, we need to take with the 7 Letter words branch is to join this onto our first branch. To do this we can join on Letter = Tile:
Note we don't need to make these the same case as Tableau Prep will figure it out!
After the join we now have a single table that looks like this:
Step 5 - Update % Chance
We can now update our % chance of drawing a tile based on the number of occurrences that it appears. Following the requirements we can use the following calculation to do this:
% Chance
IF [Number of Occurrences]<=[Frequency]
THEN POWER([% Chance],[Number of Occurrences])
ELSE 0
END
This will either return a 0 or will multiply the % chance by itself based on how many time its occurs within the word.
Our updated % chance field now looks like this:
Step 6 - Total Score
To calculate the total score that each word would score, we first need to multiply the points by the number of occurrences:
Score
[Points]*[Number of Occurrences]
Then we can use a LOD to total the points across each word:
Our table should now look like this:
From here we can then pivot the data, so that we have a new field for each letter, using a rows to columns pivot and then Sum % Chance:
Then finally we need to tidy the null values by using the following calculation:
% Chance
IIF(ISNULL([A]),1,[A])
*IIF(ISNULL([B]),1,[B])
*IIF(ISNULL([C]),1,[C])
*IIF(ISNULL([D]),1,[D])
*IIF(ISNULL([E]),1,[E])
*IIF(ISNULL([F]),1,[F])
*IIF(ISNULL([G]),1,[G])
*IIF(ISNULL([H]),1,[H])
*IIF(ISNULL([I]),1,[I])
*IIF(ISNULL([J]),1,[J])
*IIF(ISNULL([K]),1,[K])
*IIF(ISNULL([L]),1,[L])
*IIF(ISNULL([M]),1,[M])
*IIF(ISNULL([N]),1,[N])
*IIF(ISNULL([O]),1,[O])
*IIF(ISNULL([P]),1,[P])
*IIF(ISNULL([Q]),1,[Q])
*IIF(ISNULL([R]),1,[R])
*IIF(ISNULL([S]),1,[S])
*IIF(ISNULL([T]),1,[T])
*IIF(ISNULL([U]),1,[U])
*IIF(ISNULL([V]),1,[V])
*IIF(ISNULL([W]),1,[W])
*IIF(ISNULL([X]),1,[X])
*IIF(ISNULL([Y]),1,[Y])
*IIF(ISNULL([Z]),1,[Z])
After this calculation we can remove any unneeded fields and our table should look like this:
Step 7 - Filter & Rank
The final steps are to filter out the words with 0% chance and then rank the remaining words.
First we can use a filter to exclude 0 from the % Chance field
Then we can create two rankings, Likelihood and Points Rank:
Likelihood
Points Rank
After completing both of the ranks, we are ready to output our data! Our output should look like this:
You can also post your solution on the Tableau Forum where we have a Preppin' Data community page. Post your solutions and ask questions if you need any help!
Free isn't always a good thing. In data, Free text is the example to state when proving that statements correct. However, lots of benefit can be gained from understanding data that has been entered in Free Text fields. What do we mean by Free Text? Free Text is the string based data that comes from allowing people to type answers in to systems and forms. The resulting data is normally stored within one column, with one answer per cell. As Free Text means the answer could be anything, this is what you get - absolutely anything. From expletives to slang, the words you will find in the data may be a challenge to interpret but the text is the closest way to collect the voice of your customer / employee. The Free Text field is likely to contain long, rambling sentences that can simply be analysed. If you count these fields, you are likely to have one of each entry each. Therefore, simply counting the entries will not provide anything meaningful to your analysis. The value is in ...
Challenge by: Jenny Martin As I've mentioned before in a previous challenge, I'm a big fan of a quiz show called Richard Osman's House of Games. However, I've often found the way that they decide the overall winner of the week a little troubling. Each day the player who has scored the most, will receive 4 points, 2nd place will receive 3 points, 3rd place will receive 2 points and last place will receive one point. These points will be added up across the week to determine the overall winner, but with a twist! Each Friday double points are awarded so 1st place receives 8 points and so on. This leads me to wondering: Would there be a different winner if there was no double points Friday? What about if participants weren't ranked at the end of each day and they had a running total score across the week instead, would that lead to a different winner? What about doubling the scores on the Friday, instead of the points awarded? Input Luckily I didn't have to collect ...
Created by: Carl Allchin Welcome to a New Year of Preppin' Data challenges. For anyone new to the challenges then let us give you an overview how the weekly challenge works. Each Wednesday the Preppin' crew (Jenny, myself or a guest contributor) drop a data set(s) that requires some reshaping and/or cleaning to get it ready for analysis. You can use any tool or language you want to do the reshaping (we build the challenges in Tableau Prep but love seeing different tools being learnt / tried). Share your solution on LinkedIn, Twitter/X, GitHub or the Tableau Forums Fill out our tracker so you can monitor your progress and involvement The following Tuesday we will post a written solution in Tableau Prep (thanks Tom) and a video walkthrough too (thanks Jenny) As with each January for the last few years, we'll set a number of challenges aimed at beginners. This is a great way to learn a number of fundamental data preparation skills or a chance to learn a new tool — New Year...