2022: Week 7 - Call Center Agent Metrics
Challenge by: Kate Brown
This week we have another incredible challenge created by Tableau Social Ambassador Kate Brown:
For this week’s challenge we need to create a data set for our call center agent metrics. We have 2 Excel files that contain the monthly metrics for the agent and another file that contains the agent, leader, location, and goals.
If you work with databases you may encounter situations were you have one table that has ids and another table(s) that have the descriptors for those ids. We aren’t connecting to a database in this example, however, think about the people, location, leader, and date inputs in that way.
Inputs
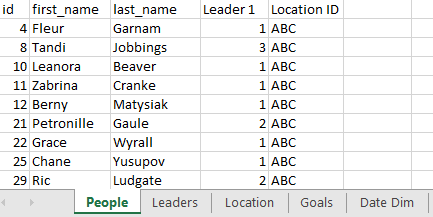
- People Data:
- People
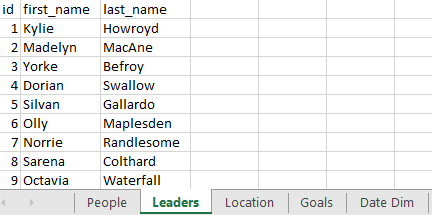
- Leaders
- Location
- Goals
- Date Dim
- Metric Data 2021:
- Jan - Dec


Requirements
- Input the data
- People, Location, Leader, and Dates:
- Join the People, Location, and Leader data sets together
- Remove the location id fields, the secondary leader id field
- Create last name, first name fields for the agent and the leader
- Limit the dates to just 2021 and join those to the People, Location, Leader step
- Keep the id, agent name, leader 1, leader name, month start date, join, and location field
- Monthly Data
- union the worksheets in the input step
- merge the mismatched fields
- create a month start date
- remove the table names and file paths field
- join the data with the people - remember we need to show every agent for every month
- Goals
- add the goals input to the flow
- clean the goal data to have the goal name & numeric value
- add the goals to the combined people & data step
- be sure that you aren't increasing the row count - the goals should be additional columns
- Metrics & Met Goal Flags
- create a calculation for the percent of offered that weren't answered (for each agent, each month)
- create a calculation for the average duration by agent (for each agent, each month)
- create a calculation that determines if the sentiment score met the goal
- create a calculation that determines if the not answered percent met the goal
- Output the data
Output

- 18 fields
- id
- Agent Name
- Leader 1
- Leader Name
- Month Start Date
- Location
- Calls Answered
- Calls Not Answered
- Not Answered Rate
- Met Not Answered Rate
- Not Answered Percent < 5
- Calls Offered
- Total Duration
- Agent Avg Duration
- Transfers
- Sentiment
- Sentiment Score >= 0
- Met Sentiment Goal
- 1620 rows (1621 including headers)
You can download the full outputs here.
After you finish the challenge make sure to fill in the participation tracker, then share your solution on Twitter using #PreppinData and tagging @Datajedininja, @JennyMartinDS14 & @TomProwse1
You can also post your solution on the Tableau Forum where we have a Preppin' Data community page. Post your solutions and ask questions if you need any help!


