2022: Week 7 - Solution
Solution by Tom Prowse and you can download the workflow here.

In the challenge with want to combine various tables to help us monitor our metrics within the call centre. This is trying to replicate the scenario where you connect to a database table that has ids and another table with descriptor for those ids.
Step 1 - Location, People, & Leaders
The first step is to input the tables from the PeopleData Excel file. At first we want to bring in the Location, People, and Leaders tables and then combine these into a single table.
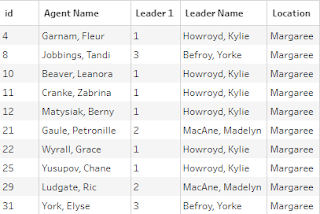
First we can join the Location & People by using the Location ID field:


From here we can remove any of the fields that we no longer require so that our table looks like this:
Step 2 - Add 2021 Dates
Within the requirements we want to limit the dates to just 2021, so therefore we can use a filter to remove some results. Within the 'Filter Values' we can use the following calculation:
YEAR([Month Start Date]) = 2021
This will keep only the dates from 2021.
We can now combine the two branches, but the problem we have is there isn't a common field to do this join on. Therefore, we want to join all of the dates onto all of the 'people' rows by using a cross-join. To create the cross-join we need to create a field that is common across both tables. It doesn't matter too much what this is, so we have created a 'Join' calculation that is equal to 1.

Notice how the number of rows increases massively, as we are joining every row onto to each other.
After this join our table should now look like this:

Step 3 - Join Metrics

- Calls Offered + Offered
- Calls Not Answered + Not Answered
- Calls Answered + Answered
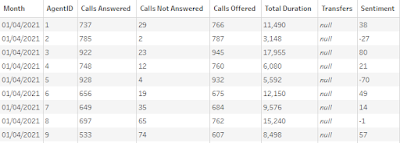
At this stage the Metrics table should look like this:
We can now combine our workflow with the Metrics table, by using an outer join where we return all of the values from our original workflow. Note, that some of the metrics don't match therefore we need to use the outer join to return all of our rows.
The join condition is where ID = Agent ID and Month Start Date = Month

After the join our table should look like this:

Step 4 - Combine Goals
Then we can need to create the join calculation (1) that we used earlier within the workflow. We'll need this for the join later!
Before the join, we want to change the shape of our table so that each of our Goals is in a separate field. Therefore, we can use a rows to columns pivot where the pivoted values is the Goals field and Goal Value is the aggregate field.

Our Goals table should now be a single row that looks like this:

We are now ready to join the Goals to our workflow using the Join field that we created earlier:

Our table now looks like this:

Step 5 - Final Tidy
The last step this week is to give the table a final tidy so that it matches our desired output. First we want to round some of our numbers:
Not Answered Rate
ROUND([Calls Not Answered]/[Calls Offered],3)
Agent Avg Duration
ROUND([Total Duration]/[Calls Answered],0)
Then we want to calculate whether or not we met the various goals:
Met Sentiment Goal
[Sentiment] >= [Sentiment Score >= 0]
Met Not Answered Rate
[Not Answered Percent < 5] > ([Not Answered Rate]*100)
After these calculations we should be ready to output our data:


