2022: Week 9 - Customer Classifications
Challenge by: Jenny Martin
Recently, I was doing some Tableau Desktop training that went off on a bit of a tangent. After introducing cohort analysis, I was asked whether we could see the year on year difference in the number of customers. This was answered with a quick table calculation. However, the follow up question of how to get a list of the 158 customers who didn't order again in 2019 had me fairly stumped! After lots of playing around and chatting it through with various colleagues, I came up with a solution that used LODs and Parameters, but all the while I was wishing I could solve the problem in Tableau Prep instead. So of course, I did!
I'm really excited to see the different solutions for this week so don't worry if your instinct is to deviate from the requirements below. Here are the definitions for how we will classify the customers:
- New = this is the first year the customer has ordered
- Consistent = the customer ordered this year and last year
- Sleeping = the customer has ordered in the past, but not this year
- Returning = the customer did not order last year, but has ordered this year
See full dashboard here
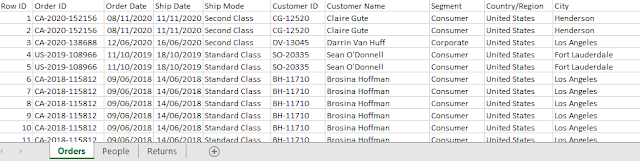
Input
Requirements
- Input the data
- Aggregate the data to the years each customer made an order
- Calculate the year each customer made their First Purchase
- Scaffold the dataset so that there is a row for each year after a customers First Purchase, even if they did not make an order
- Create a field to flag these new rows, making it clear whether a customer placed an order in that year or not
- Calculate the Year on Year difference in the number of customers from each Cohort in each year
- Cohort = Year of First Purchase
- Create a field which flags whether or not a customer placed an order in the previous year
- Create the Customer Classification using the above definitions
- Join back to the original input data
- Ensure that in rows where a customer did not place an order, the majority of the original fields are null. The exceptions to this are the Customer Name and Customer ID fields.
- Output the data
Output

- 26 fields
- Customer Classification
- YoY Difference
- Order?
- Year
- First Purchase
- Row ID
- Order ID
- Order Date
- Ship Date
- Ship Mode
- Customer Name
- Segment
- Country/Region
- City
- State
- Postal Code
- Region
- Product ID
- Category
- Sub-Category
- Product Name
- Sales
- Quantity
- Discount
- Profit
- Customer ID
- 10,396 rows (10,397 including headers)


