2022: Week 9 - Solution
Solution by Tom Prowse and you can download the workbook here.

This week the challenge was all about creating a cohort analysis that can be used to visualise in Tableau Desktop. Normally, the calculations for this type of analysis are done within Tableau Desktop, but if you want to take it a bit further then doing the calculations in Tableau Prep first can be hugely beneficial.
This challenge came off the back of one of Jenny's training sessions, so we would love it if you have any alternative solutions!
Step 1 - Year of Order
The first step is to calculate the year that each customer made an order. We can make use of Tableau's date conversions by duplicating our Order Date field, and then converting the duplicated date to a Year.

Once we have the year for each order, we can aggregate this to calculate whether a customer had made an order in that year. Within the aggregation tool, we need to group by Year of Order, Customer ID, & Customer Name. This will give us all customers who have ordered on different years.

Step 2 - First Purchase


After the join we then need to aggregate the data so that we have a single row for each year, customer and order year that they made. The aggregation is setup with by grouping Year, First Purchase, Customer ID, & Customer Name, and then finding the Max of Year of Order.

As a result, our table is now ready for us to identify whether or not an order was made in each year:
Order?
After creating the flag our table should now look like this:

Step 3 - Cohorts YoY Difference
Now that we have identified the first year of purchase, and whether or not a purchase was made in a given year, we can now start to create cohorts for each of our customers.
First we want to calculate the Year on Year difference in the number of customers from each cohort (first purchase year). To do this, we want to calculate how many customers are in each 'cohort' so we can use an aggregation tool to group the Year & First Purchase, and then Sum the Order? field, this can become our Number of Customers field:

Now we can compare the number in the current year, with the next year by creating a new branch, then adding 1 to the Year field.
Year + 1
[Year]+1
Then finally, rename the Number of Customers, to Last Years Customers.
Next, we want to compare the Year + 1 field with the Year field from our original data set, so we can join back to our previous clean step, and join where First Purchase = First Purchase and Year = Year + 1:

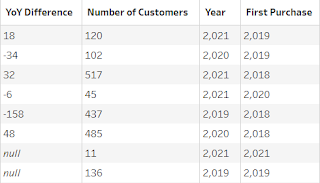
Then finally the YoY difference is calculated by subtracting the Last Year Customers from Number of Customers:
YoY Difference
[Number of Customers]-[Last Year Customers]
This part of the workflow should look like this:

Step 4 - Cohorts Ordered in Previous Year
To do this we need to join back in the customer name & ID information by joining on First Purchase and Year


We can now use an aggregate tool, to identify whether or not a customer purchased in a given year. We need to group by Year & Customer ID, and then find the Max of Order?:

We can then run a similar process as we did previously, by identifying the next year and then joining this back to our customer data.
First, we need a new branch and then we need to add 1 to the Year field.
Year + 1
[Year]+1
Now we want to rename the Order? field, to LY Order so that we can easily identify whether an order was made in the previous year.
Then we can join this back to our data set by using Customer ID = Customer ID and Year = Year +1

Our table should now look like this:

We are now ready to classify our customers into different cohorts with the following calculation:
After the classification our table should now look like this:

Step 5 - Join Original Data


