2022: Week 20 - Solution
Solution by Tom Prowse and you can download the workflow here.

The challenge this week had a Tableau Conference theme, and focussed on session attendance in the hybrid world of the virtual and in-person conference. We wanted to see who were unable to join a session that they had registered for at the conference. All data is mocked up!
Step 1 - Clean Registrations


Then a second split on the 'Email - Split 1' field to return everything before the '.':

We can then remove Email - Split 1 and rename Email - Split 1 - Split 1 to Company.
3. Number of Sessions
Finally we want to calculate how many sessions each attendee is planning to attend. We can calculate this using a Fixed LOD, where we group by Email, then Countd on Session ID:

Our table should now look like this:

Step 2 - Combine Tables

The next two tables are a bit more tricky as we need to start splitting by Online and In Person.
If we focus on the In Person table first, we can join this to our workflow using an outer join on First Name, Last Name, & Session. This will act as a filter and remove any names from our workflow who attended these sessions.

After this join we are left with a list of all users who didn't join an In Person session, therefore we need to filter this further by exclude the 'Online' values from the Online/In Person field. As a result we are left with a list of users who registered for an In Person session, but didn't attend:

Now, we can repeat this process with the Online attendance list.
Again we want to repeat the outer join, but this will we are joining on Email and Session:

Then we can filter the Online/In Person field to just retain the Online values. We should now have a list of all users who didn't attend the Online sessions:

We now have two lists of attendees who didn't attend the sessions, so we need to do a final combine to bring both of these together. As they have the same field structure, we can use a union and stack them on top of each other.

Step 3 - % of Sessions
The final steps are to calculate the number and % of sessions that people couldn't attend.
First we can calculate the total number of sessions that were not attended by using a Fixed LOD:

Then we can use that number to calculate the % of total using the following calculation:
Not Attended %
/
[No. Sessions],2)
This also rounds the number to 2 decimal places.
The last step is to rename the Session field to Session Not Attended, and then remove any additional fields.
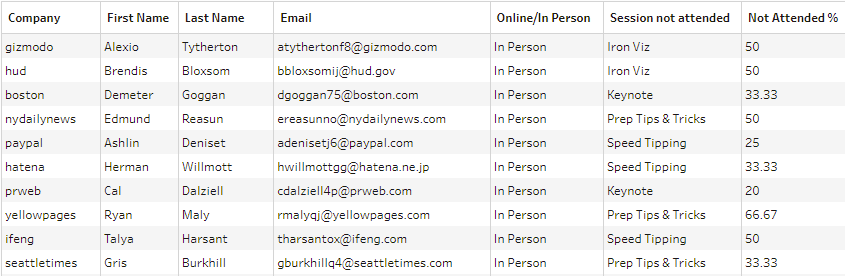
Our final output should look like this: