2022: Week 21 - Multi-sheets of Madness
Challenge by: Jenny Martin
We're returning to Chin & Beard Suds Co for this week's challenge. It's inspired by a real data structure, which needed some cleaning before connecting to Tableau Desktop.
Inputs
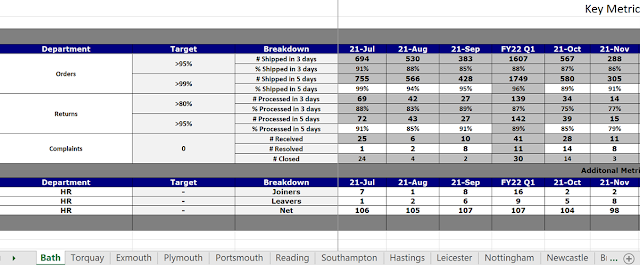
There are 12 sheets from different shops reporting the Key Metrics that we are interested in. There are Additional Metrics in a table below that are not of interest to us for this challenge.
- Connect to the data
- Bring together the Key Metrics tables from each Shop
- You'll notice that we have fields which report the quarter in addition to the monthly values. We only wish to keep the monthly values
- Reshape the data so that we have a Date field
- For Orders and Returns, we are only interested in reporting % values, whilst for Complaints we are only interested in the # Received
- We wish to update the Breakdown field to include the Department to make the Measure Name easier to interpret
- We wish to have a field for each of the measures rather than a row per measure
- We wish to have the targets for each measure as field that we can compare each measure to
- Output the data
Output
- 12 fields
- Shop
- Date
- % Orders Shipped in 3 days
- Target - % Orders Shipped in 3 days
- % Orders Shipped in 5 days
- Target - % Orders Shipped in 5 days
- % Returns Processed in 3 days
- Target - % Returns Processed in 3 days
- % Returns Processed in 5 days
- Target - % Returns Processed in 5 days
- # Complaints Received
- Target - # Complaints Received
- 120 rows (121 including headers)
You can download the full output here.
After you finish the challenge make sure to fill in the participation tracker, then share your solution on Twitter using #PreppinData and tagging @Datajedininja, @JennyMartinDS14 & @TomProwse1
You can also post your solution on the Tableau Forum where we have a Preppin' Data community page. Post your solutions and ask questions if you need any help!


