Posts

Showing posts from June, 2022

2022: Week 26 - Making Spotify Data Spotless

Image
Challenge By: Algirdas Grajauskas It's always great when a Data Schooler in training comes up with an idea for a Preppin' Data Challenge! Al is part of DS31 and has been in training for 3 months now. For this challenge we're going to clean up and analyse his Spotify data.  Input Unclean Spotify data – from Spotify  Requirements Input the data Create a new field which would break down milliseconds into seconds and minutes e.g. 208,168 turned into minutes would be 3.47min Extract the year from the timestamp field Rank the artists by total minutes played overall For each year, find the ranking of the artists by total minutes played Reshape the data so we can compare how artist position changes year to year Filter to the overall top 100 artists Output the data Output 10 fields Overall Rank Artist Name 2015 2016 2017 2018 2019 2020 2021 2022 100 rows (101 including headers) You can download the  full output here .  After you finish the challenge make sure to fill in ...
2022: Week 25 - Solution

Image
Solution by Tom Prowse and you can download the workflow here .  This week is all about using Prep to assign hotel rooms so we can find a suitable room for each of our guests. Step 1 - Additional Requests First we want to focus on the Guests table of our input, where we need to replace any of the 'N/A' additional requests with a Null value. We can do this by right-clicking on the 'N/A' row in the Profile Pane, and then selecting 'Replace with Null'. After this we want to split apart the Additional Requests field so that we have a field for each extra request. We can split these apart by using a ',' as a separator: As a result we now have 3 extra fields, each with an individual request in them:  Now we can reshape the data so that we have all of the requests in a single field. To do this we can use a Columns to Rows pivot, with each of the Split fields being used. After the pivot we can replace any of the blank ('') fields with a Null, then filter...

2022: Week 25 - Housing Happy Hotel Guests

Image
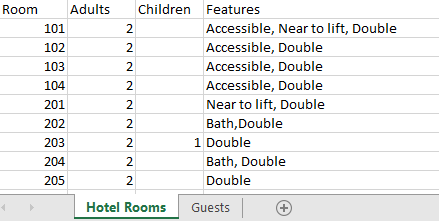
Challenge by: Jenny Martin Imagine you're working at a hotel and the process of assigning guests to hotel rooms is very manual and often based off the expertise of those that have worked in the hotel for a long time. You've managed to pick the experts' brains to get a comprehensive list of the features of each hotel room and you want to build a simple proof of concept workflow that would allow users to immediately see which rooms would be suitable for each guest. We're not worrying about assigning guests to rooms just yet, this is just the first step to proving how an automated workflow could help to make life easier! For a room to be suitable for a guest it must: Have enough capacity for all adults and children in the party (no one's allowed to sleep on the floor!) Have either double or twin beds as per the guest's preference Be accessible if the guest has accessibility requirements Satisfy as many of the additional requirements as possible Inputs Hotel Rooms  ...

2022: Week 24 - Solution

Image
Solution by Tom Prowse and you can download the workflow here.   The challenge this week came from  Jorge Supelano  who wanted to know about the longest flights ever taken. Let's see how we can prepare the data, ready to build his viz! Step 1 - Remove Airport Names First we want to remove all of the airport names from the To and From fields so we are left with just the city names.  All of the additional airport names come at the end of the string, therefore we want to create a common separator that we can use to split these values off. Currently, there is a mix of '-', '–' and '/', therefore we can use the Replace function to make these the same. From REPLACE(REPLACE([From],'-','/'),'–','/') This replaces both of the '-' and '–' with a '/', that we can then use to split off the first part of the string: Then tidy the From field by removing the original, then renaming the newly split field to From.  We n...

2022: Week 24 - Longest Flights

Image
Challenge by:  Jorge Supelano Have you ever wondered about the longest flights ever taken? Let's prep all the data required to answer that question and build a viz like Jorge's! Find Jorge's viz here Inputs Non-stop flights (top 30, by great-circle distance) - from Wikipedia   World City Latitudes and Longitudes - from SimpleMaps Requirements Input the data Remove the airport names from the From and To fields e.g. New York-JFK should just read New York Create a Route field which concatenates the From and To fields with a hyphen e.g. Dubai - Dallas Split out the Distance field so that we have one field for the Distance in km and one field for the Distance in miles Ensure these fields are numeric Rank the flights based on Distance Use a dense rank in order to match the wikipedia page The Scheduled duration is a Date/Time data type. Change this to a string so that we only keep the time element Update the First flight field to be a date Join on the lat & longs for the From ...

2022: Week 23 - Solution

Image
Video Solution here Solution by Tom Prowse and you can download the workflow here .  This week we have another collaboration and this time it's with our old friends at #WorkoutWednesday. For this collaboration we are looking to connect to Salesforce data and look to analyse some opportunity data. Step 1 - Opportunity Table The first step this week is to input the Opportunity table and then reshape it so that we have a row for when each Opportunity was Opened and a row for the Expected Close Data. We can use a Columns to Rows pivot for this, where we pivot on the CloseDate & CreatedDate fields:  After the pivot we can rename the auto generated pivot fields:  Pivot1 Values to Date Pivot1 Names to Stage Then within the Stage field, we can rename the values: CreatedDate to Opened CloseDate to ExpectedCloseDate We also need to rename a couple of the other fields within the Stage field: Stage IF [Stage]='ExpectedCloseDate' AND CONTAINS([StageName],'Close') THEN [Stage...

2022: Week 23 - PD x WOW Salesforce Opportunities

Image
Challenge by: Lorna Brown It's that time of year again when we team up with the Workout Wednesday crew! This year we wanted to work with Salesforce data as sometimes it needs a little bit of prep before you can create the charts that you want. For example, if we want to create a gantt chart to see how long each opportunity spent in each stage of the pipeline, we may want to reshape our data and bring 2 tables together. Remember, although we design these challenges in Tableau Prep, you're more than welcome to tackle them in whatever data prep tool you have at your disposal! Be that PowerBI, CRM analytics, Alteryx, Python, R - we see solutions from each of these tools and encourage you to give it a try and give us a shout on Twitter if you get stuck at all. Inputs Opportunity Table (45 fields)  Opportunity History Table  Requirements Input the data For the Opportunity table: Pivot the CreatedDate & CloseDate fields so that we have a row for when each opportunity Opened and ...

2022: Week 22 - Solution

Image
Solution by Tom Prowse and you can download the workflow here . This week we joined forces with a couple of other community initiatives ( #GamesNightViz  and  #DataFamCon ) to bring you a challenge all about Dungeons & Dragons. We want to look at how long each character speaks during each episode of the podcast 'Critical Role' so that we can create a visualisation from this. Step 1 - Union Data First we want to union our data sets together so that we can work out the difference from one timestamp to the next, and also identify when an episode ends based on the last timestamp. We can input both of our data sources, we don't need to do anything with the Dialogue table but in the Episode Details we need to rename 'runtime_in_secs' to 'time_in_secs' then keep only the Episode and the Time_in_secs fields. Now we can union both tables together so that the table look like this: Step 2 - Timestamp Rank Next we need to rank the timestamps in each episode so that ...