2022: Week 22 - Dungeons & Dragons: Critical Role
Challenge by: Will Sutton

We're starting June with a collaboration with #GamesNightViz and #DataFamCon: a monthly challenge with topics covering a wide range of the geeky world including TV Series, films, books, and even some data about geek culture and conventions itself.
For this challenge, we'll be looking at a Dungeons and Dragons dataset from the podcast "Critical Role". If we wanted to know how long each character speaks for during each episode we'd need to do a little bit of preppin' to prepare the dataset for such an analysis.
There's an additional bonus challenge to build the following dashboard using the data we'll prep. Find the details at the bottom of this post!
 |
| Find the viz designed by the super talented Christina Gorga here |
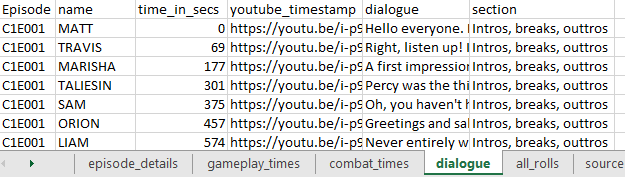
Inputs
- Episode Details
- Dialogue

Requirements
- Input the data
- To create our gantt chart we'll need to work out how long each character is talking. To do this we can work out the difference from one timestamp to the next. However for the last lines of dialogue we'll need to know when the episode ends. To do this we'll need to union the dialogue with the episode details to find the last timestamp
- Create a rank of the timestamp for each episode, ordered by earliest timestamp
- Think carefully about the type of rank you want to use
- Create a new column that is -1 the rank, so we can lookup the next line
- Create a duplicate dataset and remove all columns except
- episode
- next_line
- time_in_secs
- Inner join these two datasets
- Calculate the dialogue durations
- Some character names are comma separated, split these names out and trim any trailing whitespace
- It's ok to leave "ALL" as "ALL"
- Reshape the data so we have a row per character
- Filter the data for just Gameplay sections
- Ensure no duplication of rows has occurred
- Output the data
Output
- 7 fields
- Episode
- name
- start_time
- Duration
- youtube_timestamp
- dialogue
- section
- 270,809 rows (270,810 including headers)
You can download the full output here.
After you finish the challenge make sure to fill in the participation tracker, then share your solution on Twitter using #PreppinData, #GamesNightViz and #DataFamCon and tagging @Datajedininja, @JennyMartinDS14 & @TomProwse1, @WJSutton12, @StyleSTEAMed & @NicoleKlassen12
You can also post your solution on the Tableau Forum where we have a Preppin' Data community page. Post your solutions and ask questions if you need any help!
Bonus Challenge
Now we've prepped the data, we can build a Gantt chart.
You can build a Gantt in a few steps:
- Load the data in Tableau
- Add "Start Time" to Columns
- Add "Name" to Rows
- Add "Duration" to Size
- Next are some design choices for your viz
- There are several episodes to choose from, you may want to give your user a filter to pick an episode or share your favourite episode
- How would you like to share the character dialogue with your readers? Christina has used tooltips to share this data
- All the dialogue comes with YouTube timestamps - you could add these as URL actions
(You can add the #GamesNightViz crew but I’m aware there will be a lot of tags going on! #GamesNightViz @Visual_Endgame, @ninjavizlouis & @WJSutton12)


