2022: Week 27 - C&BSCo Clean and Aggregate
Created by: Carl Allchin
Each January the Preppin' crew like to offer you the chance to learn the fundamentals. This year we are going further by using July and August to not just learn the basics but also learn the intermediate skill level data prep skills too. Some of these skills maybe familiar to you but hopefully the practice will make data prep perfections.
If you haven't taken part in one of these challenges before we offer up a weekly challenge set on a Wednesday. A solution post will be published the following Tuesday with a written and video solution. To take on the challenge, download the data, follow the requirements and check your output against our own. We will tell you field names and row counts to provide a quick overview. The order of the data fields and rows does not matter unless stated in the requirements.
All the challenges for the next two months will focus on Chin & Beard Suds Co (C&BSCo) a soap retailer that struggles with data cleanliness.
This week we will start with inputing a single file but producing two separate outputs. Although this is a simple technique, occasionally you will need to treat different parts of your data set separately so this challenge should help you practice for that eventuality.
If you are newer to data preparation, here are some help articles / videos to assist you in completing the challenge:
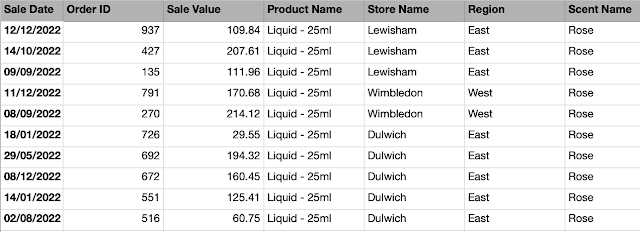
Input
Requirements
- Input the data - download from here
- Separate out the Product Name field to form Product Type and Quantity
- Rename the fields to 'Product Type' and 'Quantity' respectively
- Create two paths in your flow:
- One to deal with the data about Liquid Soap sales
- One to deal with the data about Bar Soap sales
- For each path in your flow:
- Clean the Quantity field to just leave values
- For Liquid, ensure every value is in millilitres
- Sum up the sales for each combination of Store, Region and Quantity
- Also, count the number of orders that has the combination of Store, Region and Quantity. Name this field 'Present in N orders'
- Output each file from the separate paths
Output
- Quantity
- Store Name
- Region
- Sales Value
- Present in N orders
- Quantity
- Store Name
- Region
- Sales Value
- Present in N orders


