2022: Week 30 - Solution
Solution by Tom Prowse and you can download the workflow here.

This is our final week of fundamental challenges throughout the month of July and the last challenge helps to combine a few of the techniques that we've used along the way.
Step 1 - Union East & West
The first step this week is to focus on the fundamental technique of combining data sources via a Union. Unions allow us to 'stack' tables on top of each other, so is perfect for when we want to extend our data set especially when they have a similar field structure.
As we are looking to combine the East & West Sales Person tables, the union is the perfect choice here as they have the same fields in both tables. After bringing both tables into our workflow, we can drag one on top of another and create the union step.

In a new clean step we first want to isolate the East and West parts of the string. There are a couple of different ways that we can do this using Split, Right etc.


In our case we have used a combination of both. First a custom split on the last 1 field after the '(':

Then we can use the Left function to extract each word:
Region
LEFT([Region],4)
Finally we can now remove the Table Names field and our table should look like this:
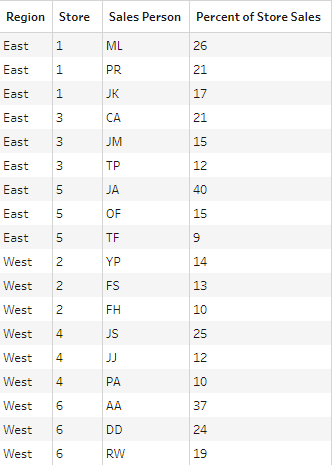
Step 2 - Combine Stores
Now we have our East & West Sales Person tables together, we can start to combine the other data sources within our inputs.
First we want to combine our workflow with the table relating to Stores. We can join these together using an inner join where Region = Region and Store = StoreID:

After the join we can remove any unneeded fields and our table should now look like this:

Step 3 - Combine Sales
The next table that we want to include in our workflow is based around the sales data. This table contains all of the sales across our stores on a sale by sale basis. Although this level of information is good for seeing each individual sale, for this workflow we want to change the granularity and return a total sales for each store, region combination.

By changing the granularity this table is now at a level where we can easily join it to our workflow without having our table 'explode' with lots of duplicated rows.
To join to our workflow, this time we can use an inner join where Store Name = Store Name and Region = Region:

Notice how there are 18 rows before and after the join. This is due to us aggregating the Sales table before joining, if we didn't do this then the number of rows after the join would have been massively increased.
The table after the join looks like this:

The final task that we need to do on this week's challenge is to calculate the actual sales per sales person. We can do that using the following calculation:
Sales per Person
[Sale Value]*([Percent of Store Sales]/100)
[Sale Value]*([Percent of Store Sales]/100)
After this calculation we are ready to output our data that should look like this:

You can download the full output here.
After you finish the challenge make sure to fill in the participation tracker, then share your solution on Twitter using #PreppinData and tagging @Datajedininja, @JennyMartinDS14 & @TomProwse1
You can also post your solution on the Tableau Forum where we have a Preppin' Data community page. Post your solutions and ask questions if you need any help!


