2022: Week 35 C&BSCo Summary Stats
Created by: Carl Allchin
The CEO was delighted to be able to analyse their individual Spin Classes last week. Now they would like to understand their overall performance. Their cycling equipment doesn't capture speed so you will need to guess their average pace.
Input
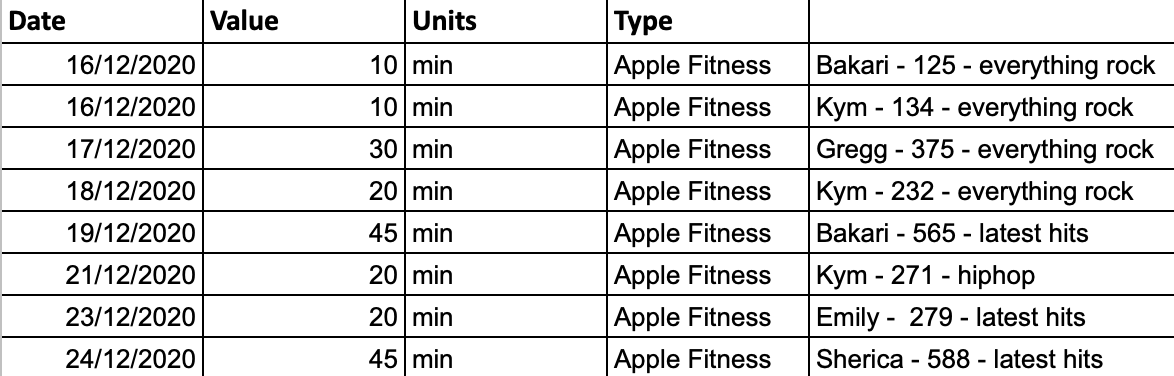
One csv file (same as last week)
Requirements
- Input data
- Merge km's and min's as Minutes
- Split the unnamed column into
- Coach
- Calories
- Music Type
- Convert the Dates to Years
- Create a parameter to let the user select any speed as the average riding speed (KPH)
- Your values may differ depending on my average speed (I used 30 kph)
- Create the following aggregations
- Total Minutes
- Total Minutes per Coach (find the most minutes per Coach)
- Calories per Minute per Coach (find the max calories per minute per Coach)
- Avg. Calories per Ride
- Total Rides
- Total Distance ((Mins/60)*Speed Parameter)
- Avg. Calories per Minute
- Combine all the answers and restructure your data if necessary
- Output the data
Output
Using 30KPH as the speed parameter:

3 Fields:
- Measure
- 2022
- 2021
7 Rows (8 incl. headers). Your values may differ depending on my average speed (I used 30 kph)
You can download the full output here.
After you finish the challenge make sure to fill in the participation tracker, then share your solution on Twitter using #PreppinData and tagging @Datajedininja, @JennyMartinDS14 & @TomProwse1
You can also post your solution on the Tableau Forum where we have a Preppin' Data community page. Post your solutions and ask questions if you need any help!


