2022: Week 46 - Dynamically fixing Table Structures
Challenge by: Jenny Martin
The system that created the strange data structure we worked with last week has created more tables in the same structure for other Regions. Luckily we have the workflow we build last week that we can simply edit to work for all Regions.
Inputs
- The workflow we built last week
- Regional metrics for:
- London (the dataset we used last week)
- Northern
- Scotland
- Wales
Example of London metrics:
Requirements
- Input the data
- Bring in the data from all the Regions and update the workflow so that no rows get duplicated
- Output the data
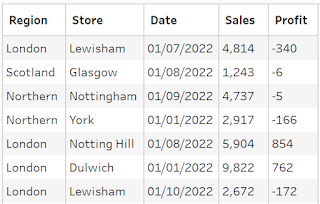
Output
- 5 fields
- Region
- Store
- Date
- Sales
- Profit
- 100 rows (101 including headers)
You can download the full output here.
After you finish the challenge make sure to fill in the participation tracker, then share your solution on Twitter using #PreppinData and tagging @Datajedininja, @JennyMartinDS14 & @TomProwse1
You can also post your solution on the Tableau Forum where we have a Preppin' Data community page. Post your solutions and ask questions if you need any help!


