This week we look at some unique analysis that I don't think many people would have looked into before! We want to look at the comparison between Chelsea Football Club managers and UK Prime Ministers. A big thank you to Stephen Moyse for the challenge!
Step 1 - Prime Ministers
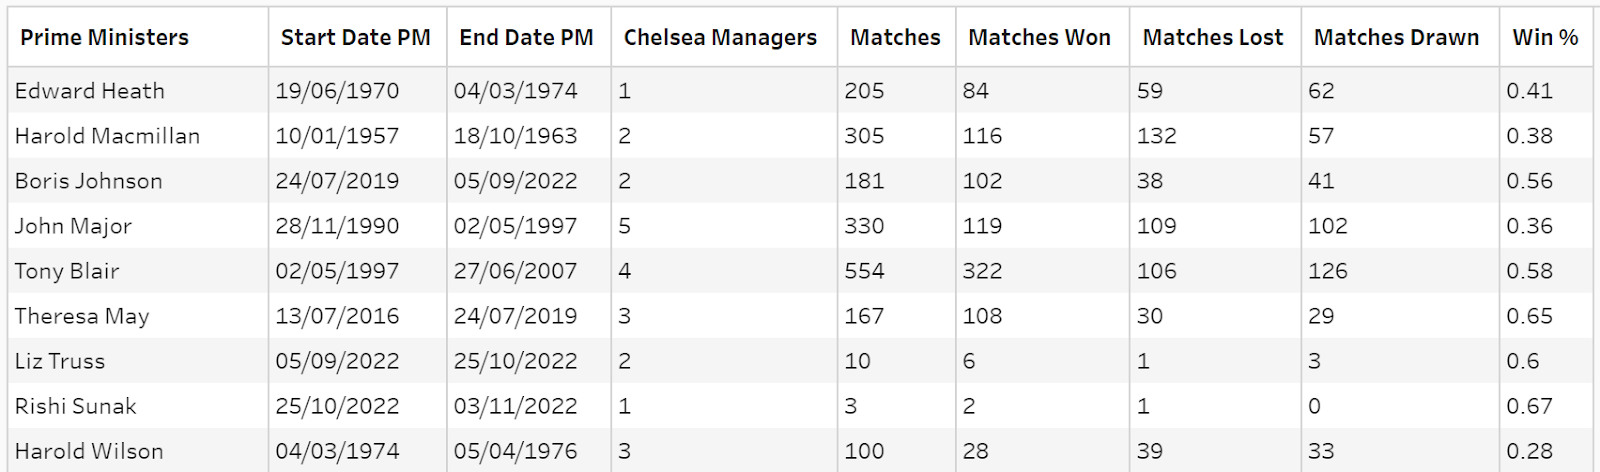
First we want to focus on the Prime Ministers so will input the table containing the list of Prime Ministers and their duration in office.
Winston Churchill has been split out in 'Winston Churchill' and 'Sir Winston Churchill' so we want to select both of these and group them together.
Next, we want to find the Start and End date for each Prime Minister. This is in the Duration field so we need to split these apart into separate fields. Using a custom split, we can use a '-' as a separator and then are left with two new fields (Start Date and End Date):
After splitting the duration into separate fields we can rename the splits, and remove Duration.
Finally, we can ensure that the current Prime Minister has 'today' as the end date by replacing the Null with this calculation:
End Date PM IF ISNULL([End Date PM]) THEN TODAY() ELSE [End Date PM] END
We can now 'pad' out the rows and create a new row for every day that the Prime Minister was in office. Using the New Rows step we can ensure that a row for each day is created:
At this stage our table should look like this:
Step 2 - Chelsea Managers
Next we can input the table relating to Chelsea Managers. The first step is to remove any unneeded fields so we can use the tick boxes in the input step to select only Name, From, & To.
We can then clean the manager name to remove the part in brackets at the end of some of the names. To do this we can use a split functionality to just retain everything before the '['. Then rename this to Chelsea Managers.
We can then rename From to Start Date CM and again replace the null value in the To field to create our End Date CM:
End Date CM
IF ISNULL([To])
THEN TODAY()
ELSE
[To]
END
Then finally we can repeat the same process to create a row for each day that the manager had been in charge by using the new rows step:
At this stage our Chelsea Managers table should look like this:
Step 3 - Chelsea Matches
Our final input is related to Chelsea matches. First we need to filter to the main competitions so want to keep only:
- League
- F.A. Cup
- League Cup
- Europe
We can then format the date to remove the suffix in the days. There are different ways of doing this but you can use the following calculation:
This replaces all of the suffix with a blank space and then converts to a date.
We also need to create a dummy field to be used within the pivot step next. For this we can create a calculated field with the number 1 in it.
Next, is pivoting the table so that we have our match results in separate fields. We use a Rows to Columns pivot here with the dummy field being used to count the matches.
Then finally we can replace the nulls in each field with a 0. To do this we can just select the null and then replace it with a 0 manually. Then calculate the total matches per day using this calculation:
Matches
[Match Won]+[Match Lost]+[Match Drawn]
At this stage our table should look like this:
Step 4 - Combine Tables
We are now in a position to combine each of our tables to make a single table to do some more analysis.
First we can join the two table relating to Chelsea managers and matches. For this we want to use a right (or left) join so that we include all rows from the Managers workstream. The join calculation is where Match Date = CM Days:
Again we need to go through each of the match outcomes and replace any nulls with a 0.
We can then do a second join to include the Prime Ministers branch. This time it's an inner join where CM Days = PM Days:
After the joins our table should now look like this:
Step 4 - Count & Win %
Now we have our data sources combined, we can start to calculate some of the metrics that we are interested in.
First, we want to use an aggregation step to count the managers for each Prime Minister. Our aggregation step groups by Prime Minister, Start Date PM, End Date PM, then CTND Chelsea Managers, Sum Matches, Sum Match Won, Sum Match Drawn, Sum Match Lost:
After the aggregation we can rename a couple of fields, and then calculate the Win % using this calculation:
Win %
ROUND([Matches Won]
/
[Matches],2)
This is the final step and we are ready to output our data:
You can also post your solution on the Tableau Forum where we have a Preppin' Data community page. Post your solutions and ask questions if you need any help!
Free isn't always a good thing. In data, Free text is the example to state when proving that statements correct. However, lots of benefit can be gained from understanding data that has been entered in Free Text fields. What do we mean by Free Text? Free Text is the string based data that comes from allowing people to type answers in to systems and forms. The resulting data is normally stored within one column, with one answer per cell. As Free Text means the answer could be anything, this is what you get - absolutely anything. From expletives to slang, the words you will find in the data may be a challenge to interpret but the text is the closest way to collect the voice of your customer / employee. The Free Text field is likely to contain long, rambling sentences that can simply be analysed. If you count these fields, you are likely to have one of each entry each. Therefore, simply counting the entries will not provide anything meaningful to your analysis. The value is in ...
Created by: Carl Allchin Welcome to a New Year of Preppin' Data challenges. For anyone new to the challenges then let us give you an overview how the weekly challenge works. Each Wednesday the Preppin' crew (Jenny, myself or a guest contributor) drop a data set(s) that requires some reshaping and/or cleaning to get it ready for analysis. You can use any tool or language you want to do the reshaping (we build the challenges in Tableau Prep but love seeing different tools being learnt / tried). Share your solution on LinkedIn, Twitter/X, GitHub or the Tableau Forums Fill out our tracker so you can monitor your progress and involvement The following Tuesday we will post a written solution in Tableau Prep (thanks Tom) and a video walkthrough too (thanks Jenny) As with each January for the last few years, we'll set a number of challenges aimed at beginners. This is a great way to learn a number of fundamental data preparation skills or a chance to learn a new tool — New Year...
Challenge by: Jenny Martin As I've mentioned before in a previous challenge, I'm a big fan of a quiz show called Richard Osman's House of Games. However, I've often found the way that they decide the overall winner of the week a little troubling. Each day the player who has scored the most, will receive 4 points, 2nd place will receive 3 points, 3rd place will receive 2 points and last place will receive one point. These points will be added up across the week to determine the overall winner, but with a twist! Each Friday double points are awarded so 1st place receives 8 points and so on. This leads me to wondering: Would there be a different winner if there was no double points Friday? What about if participants weren't ranked at the end of each day and they had a running total score across the week instead, would that lead to a different winner? What about doubling the scores on the Friday, instead of the points awarded? Input Luckily I didn't have to collect ...