2022: Week 50 - Withdrawals (HR month)
Created by: Kelly Gilbert
This is the second challenge in our special HR month. Thanks too long time participant Kelly Gilbert for sharing her real world challenges she faces in her role with data prep.
______________________________
Occasionally, candidates may choose to withdraw from the hiring process. The Talent Acquisition team would like to understand where in the hiring process candidates are choosing to drop out.
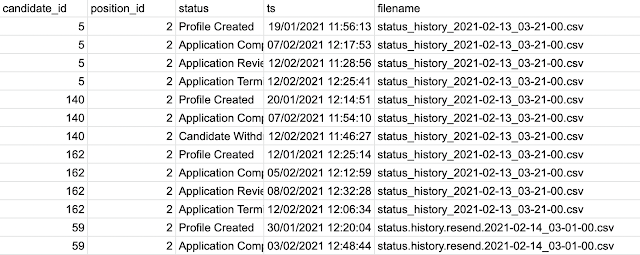
Input
Requirements
Rank the statuses based on the timestamp (ts) field, where the most recent status is 1
If the most recent status (rank #1) is “Candidate Withdrew”, find the previous status (rank #2)
Count the number of withdrawals, grouped by the previous status
Count the total number of candidate/positions that have ever been in each status
Join the total counts by status to the withdrawals by status
Make sure that statuses with no withdrawals are included in the output
Calculate the % of candidates who withdrew after each status (round to 1 decimal place, e.g. output “2.5” for 2.5%)
Clean up the columns so four columns remain:
status_before_withdrawal
total_candidates
withdrawals
Pct_withdrawn
Output
- status_before_withdrawal
- withdrawals
- total_in_status
- pct_withdrawn
You can download the full outputs here.


