It's the final week of the Intermediate month challenges and this week we are visiting the trading floor of our fictional bank - The Data Source Bank.
We want to clean up some of the trading data and then identify the top trades across a series of different ways that we look at companies.
Step 1 - Input Data
First we want to input all of our input files for each month. To do this we want to utilise the 'Union Multiple Tables' feature within the Tableau Prep input step.
After inputting one of the files, we can then choose 'Union Multiple Tables' and then use the term 'MOCK_DATA*' as our matching pattern. This will bring all of the fields that match this pattern into our data set, whilst also adding any others that will come into that folder in the future.
Note: depending on your version of Tableau Prep, this might look slightly different.
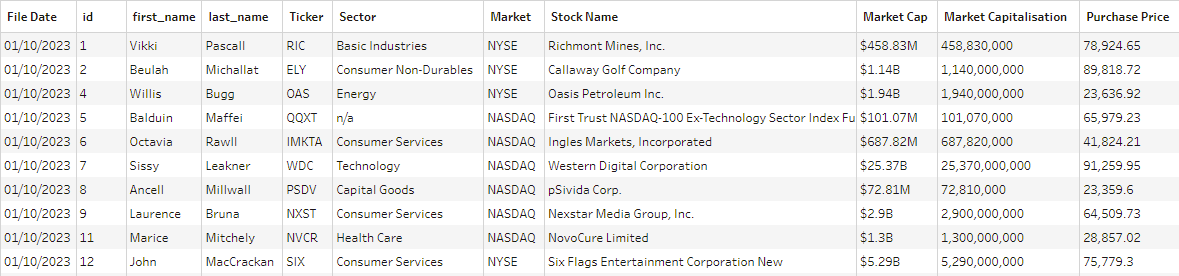
After using the wildcard input we should now have all of our tables into a single workflow and the table should look like this:
Step 2 - Create Month
Next, we want to create a file date using the month from the file name field. When using the union input this automatically creates the File Paths field and we can utilise this within our analysis.
First, we want to remove any punctuation and letters from the field using the 'Clean' functionality:
We then need to make sure that the field is a number and replace the null with a 1 (the first file didn't have a month number). Once we have all of the month numbers, we can create a date using the following calculation:
File Date MAKEDATE(2023,[File Paths],1)
Once we have created the date our table should look like this:
Step 3 - Clean Market Cap & Purchase Price
Next, we want to clean the Market Cap field so that the numbers are correct for Billions vs Millions. Within the Market Cap field we want to remove any n/a values, and then remove the $ symbol using a replace calculation:
We can then replace the B or M with the correct number of 0s using this calculation:
Market Capitalisation
IF CONTAINS([Market Capitalisation],'B')
THEN FLOAT(LEFT([Market Capitalisation],LEN([Market Capitalisation])-1))*1000000000
ELSEIF CONTAINS([Market Capitalisation],'M')
THEN FLOAT(LEFT([Market Capitalisation],LEN([Market Capitalisation])-1))*1000000
ELSE FLOAT([Market Capitalisation])
END
This will allow us to replace the B or M and transform the field into a number.
We can then categorise the Purchase Price and Market Cap as per the requirements.
Purchase Price Categorisation
IF [Purchase Price] <25000 THEN 'Small'
ELSEIF [Purchase Price] <50000 THEN 'Medium' ELSEIF [Purchase Price] <75000 THEN 'Large' ELSE 'Very Large' END
Market Capitalisation Categorisation
IF [Market Capitalisation] < 100000000 THEN 'Small'
ELSEIF [Market Capitalisation] <1000000000 THEN 'Medium'
ELSEIF [Market Capitalisation] <100000000000 THEN 'Large'
ELSE 'Huge'
END
After these calculations our table should look like this:
Step 4 - Rank
The final step that we need for this week is to rank the highest purchases per combination of file date, Purchase Price Categorisation, and Market Capitalisation Categorisation.
To do this we can use the analytical rank calculation to group by File Date, Purchase Price Categorisation, and Market Capitalisation Categorisation, then Rank the Purchase Price from high to low:
Then we want to filter the Rank field to Keep Only 1-5 and remove the ID, first_name, and last_name fields.
You can also post your solution on the Tableau Forum where we have a Preppin' Data community page. Post your solutions and ask questions if you need any help!
Free isn't always a good thing. In data, Free text is the example to state when proving that statements correct. However, lots of benefit can be gained from understanding data that has been entered in Free Text fields. What do we mean by Free Text? Free Text is the string based data that comes from allowing people to type answers in to systems and forms. The resulting data is normally stored within one column, with one answer per cell. As Free Text means the answer could be anything, this is what you get - absolutely anything. From expletives to slang, the words you will find in the data may be a challenge to interpret but the text is the closest way to collect the voice of your customer / employee. The Free Text field is likely to contain long, rambling sentences that can simply be analysed. If you count these fields, you are likely to have one of each entry each. Therefore, simply counting the entries will not provide anything meaningful to your analysis. The value is in ...
Challenge by: Jenny Martin As I've mentioned before in a previous challenge, I'm a big fan of a quiz show called Richard Osman's House of Games. However, I've often found the way that they decide the overall winner of the week a little troubling. Each day the player who has scored the most, will receive 4 points, 2nd place will receive 3 points, 3rd place will receive 2 points and last place will receive one point. These points will be added up across the week to determine the overall winner, but with a twist! Each Friday double points are awarded so 1st place receives 8 points and so on. This leads me to wondering: Would there be a different winner if there was no double points Friday? What about if participants weren't ranked at the end of each day and they had a running total score across the week instead, would that lead to a different winner? What about doubling the scores on the Friday, instead of the points awarded? Input Luckily I didn't have to collect ...
Created by: Carl Allchin Welcome to a New Year of Preppin' Data challenges. For anyone new to the challenges then let us give you an overview how the weekly challenge works. Each Wednesday the Preppin' crew (Jenny, myself or a guest contributor) drop a data set(s) that requires some reshaping and/or cleaning to get it ready for analysis. You can use any tool or language you want to do the reshaping (we build the challenges in Tableau Prep but love seeing different tools being learnt / tried). Share your solution on LinkedIn, Twitter/X, GitHub or the Tableau Forums Fill out our tracker so you can monitor your progress and involvement The following Tuesday we will post a written solution in Tableau Prep (thanks Tom) and a video walkthrough too (thanks Jenny) As with each January for the last few years, we'll set a number of challenges aimed at beginners. This is a great way to learn a number of fundamental data preparation skills or a chance to learn a new tool — New Year...