2023: Week 15 - Easter Dates
Challenge by: Jenny Martin
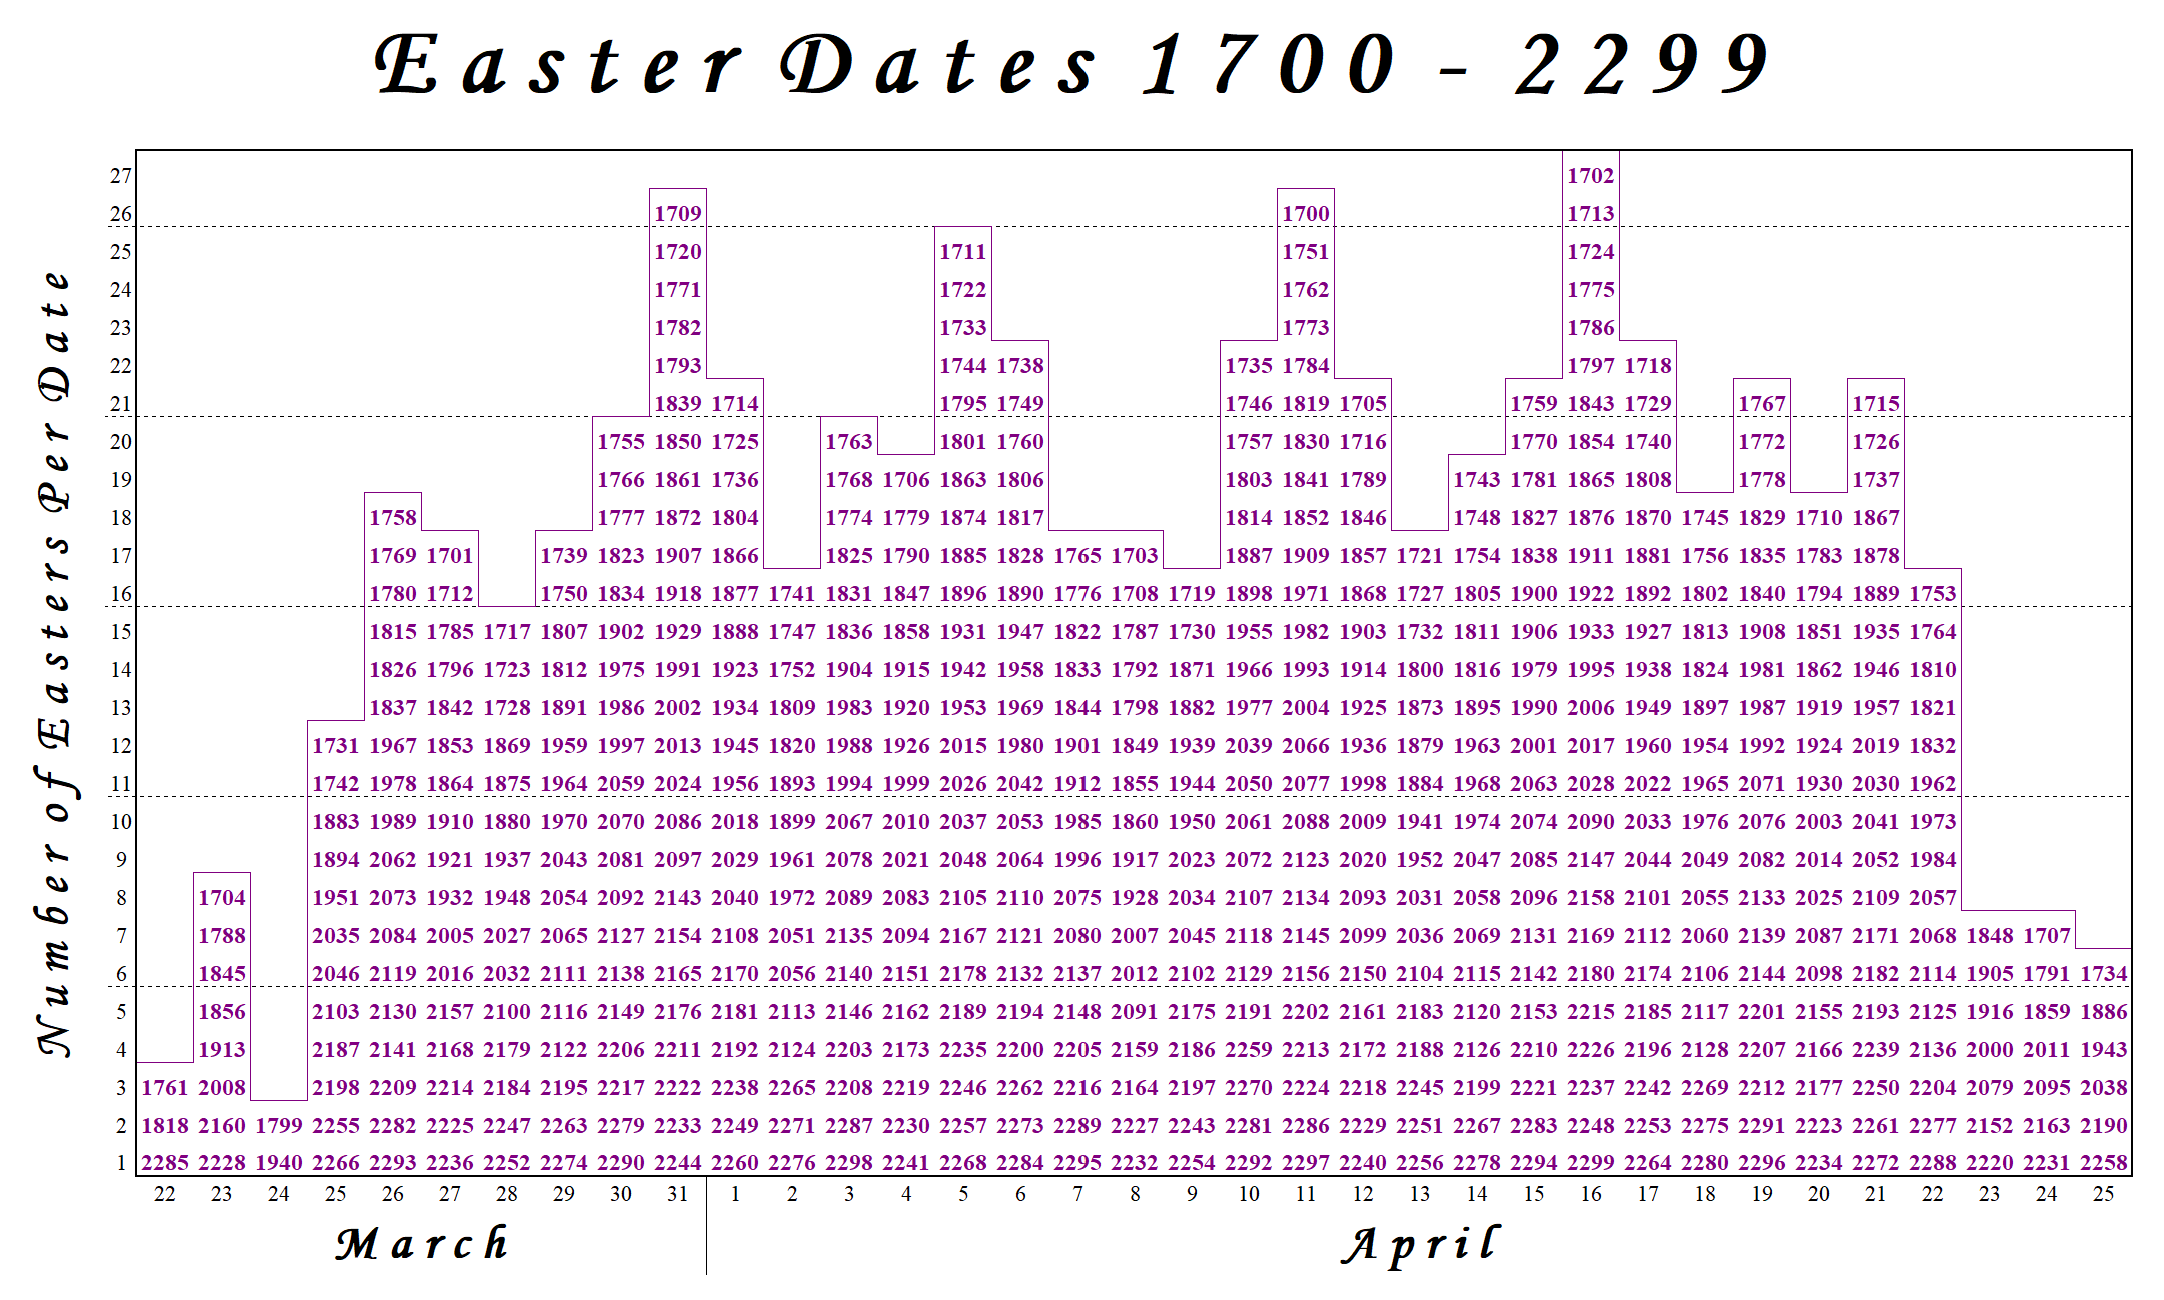
Each year there's the inevitable Google as to what day Easter Sunday will be (usually multiple times, let's be honest!) But what's the most popular date? I found a great viz to give us that answer, but what if I want the underlying dataset behind it?
Input
I downloaded this beautiful viz from Thomas Larsen, and yes, it is built in Excel.
Top Level Requirements
- Input the data
- Reshape it so that we have a list of Easter Sunday dates
- Filter the dataset so that we only have past dates
- i.e. 1700 - 2023
- Output the data
More Detailed Requirements
- Input the data
- Split the data into the years and the x-axis of the chart i.e. the day and month
- For the years, make sure there is a row per year and keep the generated column name field i.e. F1, F2 etc.
- For the day and month rows, number them
- Pivot so we have a row per day/month
- Pivot so we have the days in one field and the months in the other
- Still keeping the generated column name field
- Fill down the month names
- That generated column name field will come come in handy for ordering
- Join years back to day & month
- Filter the dataset so that we only have past dates
- i.e. 1700 - 2023
- Create an Easter Sunday date field and remove all other fields
- Output the data
Output
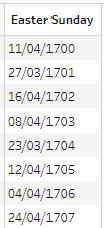
- 1 field
- Easter Sunday
- 324 rows (325 including headers)
You can download all the output from here
After you finish the challenge make sure to fill in the participation tracker, then share your solution on Twitter using #PreppinData and tagging @Datajedininja, @JennyMartinDS14 & @TomProwse1
You can also post your solution on the Tableau Forum where we have a Preppin' Data community page. Post your solutions and ask questions if you need any help!


