2023: Week 17 - Population Growth vs Country Size
Challenge by: Serena Purslow
We have a guest contributor this week! Serena is from DS36 at the Data School and passionate about working with Environmental, Social and Governance (ESG) data.
This challenge uses data directly from the world bank, but it’s a bit of a mess! The goal is to calculate the change in population per km2 across the world, to find which countries have seen the biggest increase over the past 21 years.
Inputs
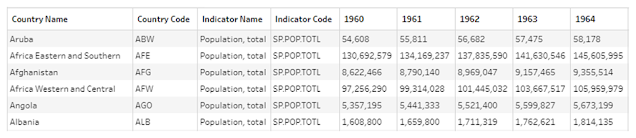
- World Population Data 1960 - 2021
- Country Size Data

Requirements
- Input the data
- Population data:
- Use the data interpreter to ensure the headers are read as headers
- Remove unnecessary fields
- Trim leading & trailing spaces from country names
- Use the Country/Region data role to tidy up country names
- Pivot data so we have 3 columns for year, population and country name
- Country size data:
- Split the Land in km2 (mi2) field to get the values for land size in km2 only
- Remove unnecessary fields - we only want country and land size km2
- Clean country names and trim any trailing spaces
- Use the Country/Region data role to tidy up country names
- Group together Jersey and Guernsey to make the Channel Islands
- Join the two datasets so that any country names/regions that aren’t in both datasets are excluded
- 36 countries from the country size file will not be included
- Exclude ‘World’ from the dataset
- Calculate the population density
- We want to be able to select which years to compare in order to work out population growth, i.e. what was the population growth from Year A to Year B. To do this, we need to create two parameters:
- One for the more recent year (You don’t need to enter every year in the dataset, just give a few examples including 2021)
- One for the less recent year (Again, don’t include every year, just a few examples including 2000)
- Set the parameters to 2000 and 2021
- Filter to just these 2 years and have the population density for each year as 2 fields in the dataset for each country (215 rows in total)
- Calculate the % change in population density between the two years
- Create a rank for % change in population density so that the country with the greatest change ranks 1
- Create another rank for total population density in 2021, so that the country with the highest density ranks 1
- Find the top 10 ranking countries for population density 2021
- Find the top 10 ranking countries for change in population density 2000-2021
Outputs
1) Top 10 Countries with Highest Population Density in 2021 

- 3 Fields:
- Country
- Population Density 2021
- Rank Population Density 2021
- 10 rows (11 including headers)
- 5 Fields:
- Country
- Population Density 2000
- Population Density 2021
- % Change in Population Density
- Rank % Change
- 10 rows (11 including headers)
You can download all the output from here.
After you finish the challenge make sure to fill in the participation tracker, then share your solution on Twitter using #PreppinData and tagging @SerenaPurslow, @Datajedininja, @JennyMartinDS14 & @TomProwse1
You can also post your solution on the Tableau Forum where we have a Preppin' Data community page. Post your solutions and ask questions if you need any help!


