2023: Week 25 - Prep School 2023 Admissions - Part 1
Challenge by: Ross Killington
This is our next challenge from one of the members of the 38th cohort of the Data School UK.
As we approach the end of the academic year, the Prep School, a prestigious science & engineering focused sixth form in the imaginary city of Dataville is taking applications for the 2023/24 academic year starting in September. The city is divided into 2 regions, the West and the East, each containing a range of secondary schools. Rather than the students applying on their own behalf, each region puts forward their top 2000 students for consideration. From this total pool of 4000 students, Prep School will only take on 100, making it a highly exclusive institution.
In part 1 of this challenge we will be creating an organised data table showing all of this year's applicants with their respective grades to allow the school to decide who will be accepted.
Because the two regions of the city work independently, the application data from each region varies slightly in terms of formatting. We will need to standardise this data in order to allow us to bring the tables together before finding a way to calculate a score for each of the students.
Inputs
There are 3 inputs this week:
1. East region applicants data: “East Students.csv”
2. West region applicants data: “West Students.csv”

3. A School name lookup table for each student: “School Lookup.csv”
Requirements
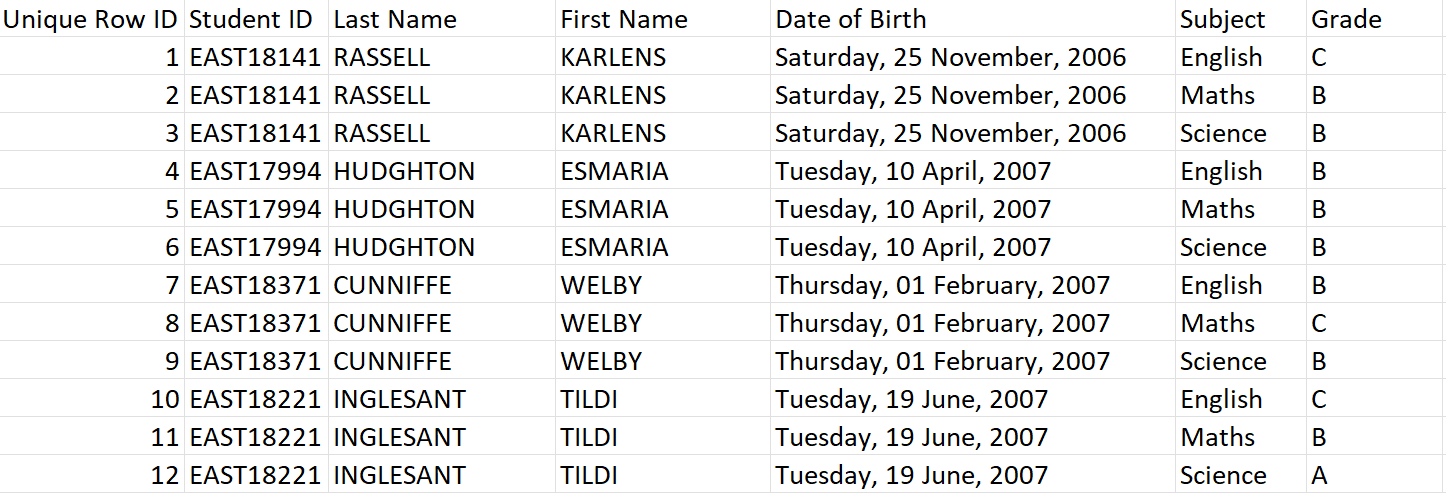
- Input the 2 data tables for East and West students
- For the East table, fix the Student ID column so that is just the 5 digit numeric code.
- For the West Table, Split the Student ID column to leave one column with the 5 digit numeric Student ID and one newly formed Region column.
- For both tables use the First & Last name columns to create a new “Full Name” column in all capital letters.
- Make sure both tables have the same date format
- Convert the values in the Grade column in the West table from numbers to letters using the following system:
- 1 = A, 2 = B, 3 = C, 4 = D, 5 = E, 6 = F
- Combine the 2 tables to form one table with 12,000 rows
- Create a new “Grade Score” Column and give each row a score according to the following system:
- A = 50, B = 40, C = 30, D = 20, E = 10, F = 0
- Find a way to transform the table so that each student is represented by only ONE row with 3 individual columns for their English, Maths & Science grades as well as a column with their total score from all of these grades combined.
- Input the School Lookup table and combine it with the current student table to allow us to see which school each student is attending.
- Clean and organise your table to match the output shown below.
- Output the data (and keep it for next week!)
Output

- 10 fields
- Student ID
- Full Name
- Date of Birth
- Region
- School Name
- School ID
- English
- Science
- Maths
- Grade Score
- 4,000 rows (4,001 including headers)


