2023: Week 25 - Solution
Video Solution


Solution by Tom Prowse and you can download the workflow here.

The challenge this week comes from Ross Killington and follows the theme of analysing some data from The Prep School. We are looking at admissions for the next academic year and we are trying to identify the top students from each region.
Step 1 - West Students
First we can input the West Students table and then split the ID field so we have the 5 digits and the region in separate fields.
To do this we can use the split on the '-' separator and this will give us a field for each which we can rename to Student ID & Region.

Next we want to transform the Grade field from 1-6 to A-F. There isn't an automatic way of doing this, however we can select each of the numbers in the profile pane and replace them with the corresponding number.
Our West table should now look like this:

Step 2 - East Students
Next we want to combine the West and the East student tables together so we can work from a single table.
To do this we need to prepare the East table so it's in the same structure as the West table. First we can ensure that the Date of Birth field is a date (not a string), then we want to extract the student ID and region.
This student ID has a little bit of a different structure and doesn't have a separator to split on. Therefore, we can duplicate the field and rename the fields to Student ID and Region. In the student ID field we want remove all letters, and in the region field we want to remove all numbers.

After this our East table should look like this:

We can now combine both of these tables using a Union step to stack them on top of each other and make the table longer - all fields should match up nicely.
Step 3 - Name & Grade
Now we have both tables in a single table we can create a full name field by combining the First and Last name fields:
Full Name
[First Name]+" "+[Last Name]
Then create a Grade Score based on the requirements:
Grade
CASE [Grade]
WHEN 'A' THEN 50
WHEN 'B' THEN 40
WHEN 'C' THEN 30
WHEN 'D' THEN 20
WHEN 'E' THEN 10
WHEN 'F' THEN 0
END
Our table now looks like this:

Step 4 - Transform Shape
Next we want to change the shape of the table so that we have a single row for each student with their grades in separate columns. To do this we can use a rows to columns pivot with each of the subjects as a new field:

We can then remove any null values by using an aggregation tool to group by Student ID, Full Name, Date of Birth, & Region, then find the Max of English, Science, & Maths and also the Sum of Grade Score:

Step 5 - School Name
Finally, we can combine the last table containing information about the Schools by joining the school lookup with our workflow using the Student ID field:

We are now ready to output our results that should look like this:
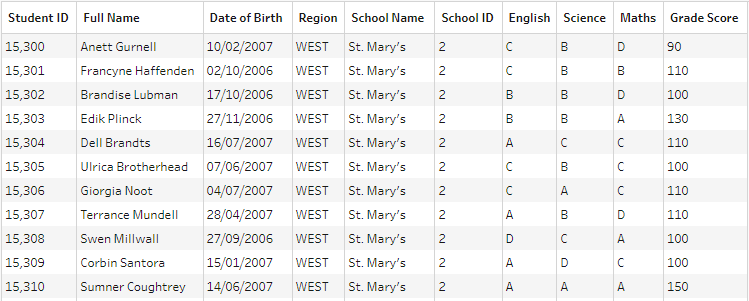
You can download the output from here.
After you finish the challenge make sure to fill in the participation tracker, then share your solution on Twitter using #PreppinData and tagging @Datajedininja, @JennyMartinDS14 & @TomProwse1
You can also post your solution on the Tableau Forum where we have a Preppin' Data community page. Post your solutions and ask questions if you need any help!


