2023: Week 30 - Solution
Solution by Tom Prowse and you can download the workflow here.
We continue to look at some of the new features within Tableau Prep this week, with a focus on % difference from and the lookup function.
Step 1 - Input Data
First up we want to input all of the data from the Excel sheet that contains all of the different months of data. To do this we can utilise the wildcard union within the input step to bring in all of the sheets to a single step.

We can then tidy the table by renaming the Table Names field to Month and then merge any fields that have a similar name. You can merge fields by selecting the fields then pressing Merge fields in the grey bar in the profile pane.
At this stage our table should look like this:

Step 2 - Dates
Next we want to format the date so it is in a traditional date field format. This involves converting the Order Date string and then combining with the month field.
First, we split Order Date using the ',' as a separator and we want to return the last 2 values (the year and day)

We can then rename the split fields to the corresponding Day and Year, then remove Order Date. Now we have all three parts of the date, we can put these together into a new Order Date:
Order Date
DATE([Day]+" "+[Month]+" "+[Year])
After creating the Order Date field, we want to identify which Quarter each of the order dates falls into. We can use the Convert Dates functionality to convert these into quarters:

Then finally we can calculate the total sales for each store per quarter using an aggregation step. Within this step we group by Store & Quarter, then return the Sum Sales.

Step 3 - % Difference From
We now come to the part of the challenge that has the new Tableau Prep features in. We want to calculate the % difference from the previous quarter. Luckily, Tableau Prep has a nice visual interface to create these calculations so we can select 'Percent Difference From' in the Create Calculated Field section of the menu.
Within this calculation we want to group by Store, then order by Quarter in an ascending order. We want to compute using the Sales fields, and then look for 1 previous value. The calculation looks like this:
% Difference Q on Q

After this calculation our table should look like this:

Step 4 - Lookup Function
Next we want to evaluate our store's performance and give them a category depending on their level of growth. Based on the requirements, we first need to find what the previous 2 quarters values were. We can do this by creating two separate lookup calculations:
Quarter - 1
{ PARTITION [Store]:{ ORDERBY [Quarter] asc : LOOKUP([% Difference Q on Q],-1)}}
Quarter - 2
{ PARTITION [Store]:{ ORDERBY [Quarter] asc : LOOKUP([% Difference Q on Q],-2)}}
Unfortunately, there isn't a visual calculation editor for the lookup function, but we can still split it up into similar sections as the Percent Difference From calculation.
The Partition part is the same as 'Group By'. So we want to group by each Store.
Then we want to order by Quarter in an ascending order.
Then finally, what do we want to calculate / return from the calculation. In this case, we want to look at the 1 or 2 previously values and then return the % Difference Q on Q.

Finally we want to categorise the stores based on the requirements. First we want to identify whether or not the change in quarters in positive or negative. We can utilise the Sign() function to return a 1 or -1 based on the positive/negative values:
Sign
SIGN([% Difference Q on Q])
+
SIGN([Quarter - 1])
+
SIGN([Quarter -2 ])
Then following this we can create an IF statement following the rules given in the requirements:
Trend
IF ABS([Sign])=3 THEN
IF [Sign]=3
THEN "Going from strength to strength"
ELSE "Going from bad to worse"
END
ELSEIF [Sign]=1 THEN
IF SIGN([% Difference Q on Q])=-1 THEN
"Good growth, until Q4"
ELSEIF SIGN([Quarter - 1])=-1 THEN
"Some good growth, but concerns in Q3"
ELSEIF SIGN([Quarter -2 ])=-1 THEN
"Good growth in last half"
END
ELSEIF [Sign]=-1 THEN
IF SIGN([% Difference Q on Q])=1 THEN
"Concerning performance, but improving in Q4"
ELSEIF sign([Quarter - 1])=1 THEN
"Concerning performance, excluding Q3"
ELSEIF sign([Quarter -2 ])=1 THEN
"Concerning performance in last half"
END
END
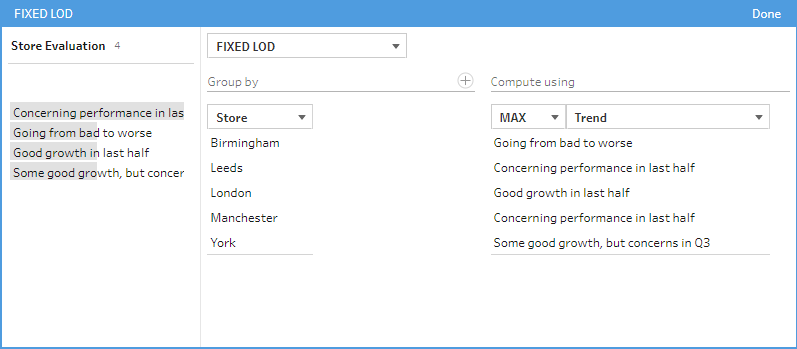
This will give us a Trend category for each Store, but will only be on the final quarter because this is where we have compared the quarters. To fill in the Nulls, and make the string on each row we can use a Fixed LOD where we return the Max Trend for each Store:
Store Evaluation
After removing the fields that we no longer need, our table should look like this:

You can download the output from here.
After you finish the challenge make sure to fill in the participation tracker, then share your solution on Twitter using #PreppinData and tagging @Datajedininja, @JennyMartinDS14 & @TomProwse1
You can also post your solution on the Tableau Forum where we have a Preppin' Data community page. Post your solutions and ask questions if you need any help!


