2023: Week 33 - Solution
Solution by Tom Prowse and you can download the workflow here.

We are onto the 3rd challenge of our HR month where we look at employees tenure and also making consistent reports, even when data is missing.
Step 1 - Tenure
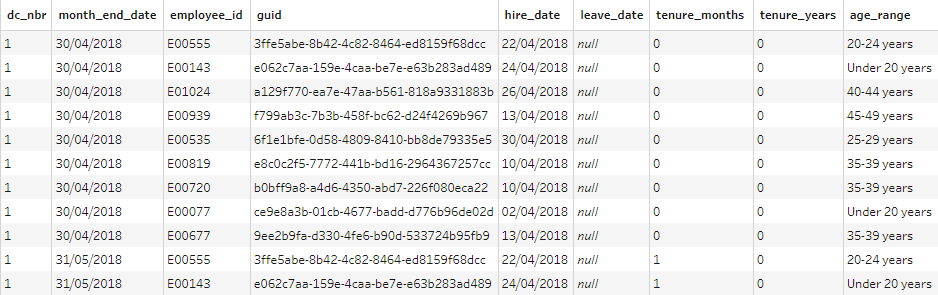
First we can input the data so ee_monthly_v3, from here we can calculate the tenure in months by finding the difference between the hire and leave dates:
Tenure_Months
IF ISNULL([leave_date]) THEN
DATEDIFF('month',[hire_date],[month_end_date])
ELSE
DATEDIFF('month',[hire_date],[leave_date])
END
Then we want to identify whether they were there for a full or partial month:
Tenure_Months
IF ISNULL([leave_date])
THEN [tenure_months]
ELSE
(IF DAY([leave_date])<DAY([hire_date])THEN [tenure_months]-1ELSE [tenure_months]END)
END
Then finally we can round down to the nearest number so that we are only looking at full months and calculating the years of service:
Tenure_Years
FLOOR([tenure_months]/12)
We can then output our data set relating the tenure:
Step 2 - Combine Dim Table
Next we can input the dim table and then remove all the fields apart from:
- employee_id
- nationality
- gender
- generation_name
From here we can join with our existing tenure branch using an inner join on employee_id:

Step 3 - Summary Records
Now we can start to summarise the results for each of the following areas:
Generations
Group by dc_nbr, month_end_date, and generation name, then countd employee_id to get the number of employees per generation:

Then we can create a new string field to give this branch a 'Generation Name' type and rename the other fields where needed:

We can then repeat the same process but instead of generation name we can replace with the following in separate aggregation steps:
- Tenure_years
- Gender
- Age_range
- Nationality
After the aggregation we also need to create a new type label on each branch as well.

Then we can bring all of these together using a union where all the fields should match nicely to create a table that looks like this

Step 4 - Missing Values
Next we want to ensure that any missing values that aren't present in the data set are filled in so that we have a consistent report across all areas.
First, we want to aggregate to find each different combination for both month and the demographics. Therefore, we can create two separate branches - the first with an aggregation grouping by dc_nbr and month_end_date

Then on a different branch we can create an aggregation where we group by demographic type and demographic detail:

Then we can bring them together by using a cross join on a dummy field that contains the number 1 (or anything else that you choose). This will give us every combination of the different months and demographics

Then we can join back onto our full data set by using an outer join where we return all of the combinations and any that match our full data. The conditions are on de_nbr, demographic_type, demographic_detail, and month_end_date:

Finally we need to replace any nulls in the ee_count field with a 0 as this is where the combination was missing in our original data set.
Our final table should look like this:

You can download the output from here.
After you finish the challenge make sure to fill in the participation tracker, then share your solution on Twitter using #PreppinData and tagging @kelly_gilbert, @ViktoriiaSSS, @Datajedininja, @JennyMartinDS14 & @TomProwse1
You can also post your solution on the Tableau Forum where we have a Preppin' Data community page. Post your solutions and ask questions if you need any help!


