2024: Week 13 - Easter Sales
Challenge by: Jenny Martin
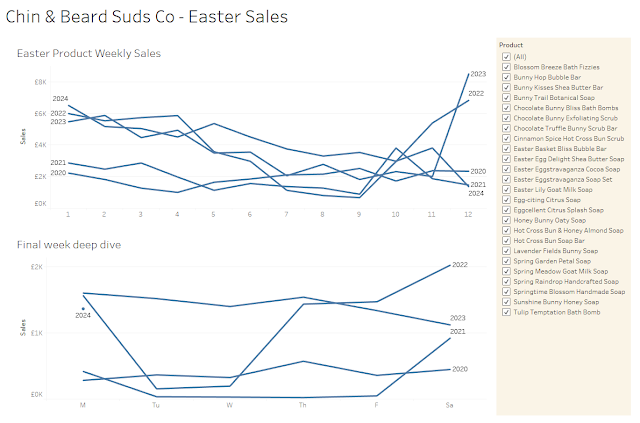
Chin & Beard Suds Co release Easter themed products each year, 12 weeks before Easter Sunday. Since the date of Easter Sunday changes each year, they have trouble comparing sales to previous years, as the weeks don't line up. They're looking to create the following dashboard to get some insight into their sales in this final week leading up to Easter Sunday.
Inputs
We have an Excel extract that contains a sheet for each year that C&BS Co have sold Easter themed products.
Requirements
- Input the data
- Bring all the years together in a single table
- Work out the Easter Week Number, as per the first line chart, so the years can be compared
- Ensure that the weeks begin on a Monday
- Make sure there is a field for which day of the week each Sales Date is in order to create the 2nd chart
- Abbreviate these weekday names as above i.e.
- Monday = M
- Tuesday = Tu
- etc.
- Add in a field for the Weekday Order so the visualisation can be sorted Monday-Sunday
- i.e. Monday = 1, Tuesday = 2 etc
- Calculate the Sales per Product per Sales Date
- Output the data
Output
- 9 fields
- Year
- Sales Date
- Easter Week Number
- Weekday
- Weekday Order
- Product
- Price
- Quantity Sold
- Sales
- 1,752 rows (1,753 including headers)
After you finish the challenge make sure to fill in the participation tracker, then share your solution on Twitter using #PreppinData and tagging @Datajedininja, @JennyMartinDS14 & @TomProwse1
You can also post your solution on the Tableau Forum where we have a Preppin' Data community page. Post your solutions and ask questions if you need any help!


