Posts

Showing posts from May, 2024

2024: Week 22 - Top 5 Loyal Customers

Image
Challenge by: Alexandra Skelly We're continuing with DS43's challenges so over to Alex  t o explain the her next challenge.  _____________________________________ Each SuperBytes store is interested in determining their most loyal customers so that they can send them all a gift. They'll need to bring many tables of data together in order to do this. Inputs There are 3 tables of data needed to achieve SuperBytes goal: Loyalty Points  Customer Details  Store Data  Requirements Input the data  (updated 3rd June) Start with the Loyalty Points table: Change the DateTime_Out field to a Date data type Extract the numeric part of the Loyalty Points field Extract the First Name and Last Name Initial from the Email Address Join to the Customer Details table, ensuring the number of rows remains at 999 Join on the Store Data table Remove unnecessary fields Filter out customers without postcodes (it will be difficult to send gifts to these customers!) For each stor...
2024: Week 21 - Solution

Image
Solution by Tom Prowse and you can download the workflow here . Step 1 - Loyalty Points After inputting the data, we can first calculate the loyalty points for each customer:  Loyalty Points ROUND([Sale Total]/50,1) Then we can categorise the customers based on the number of points they have:  Category   IF [Loyalty Points]>=7 THEN "MegaByte" ELSEIF [Loyalty Points]>=5 THEN "Byte" ELSE "No Byte" END At this stage our table has two new columns that look like this:  Step 2 - Aggregate & Pivot Next we want to total the number of customers who qualify for each category by using an aggregation step:  Then once we have aggregated we need to pivot the data so that Male & Female genders have a separate column. For this we want to use a Rows to Columns pivot:  The final task is to calculate the % of Total for Male & Female. First we need to calculate the total of each by adding both the Male and Female totals together:  Total   [Male]+[Fe...

2024: Week 21 - Loyalty Points Percentages

Image
Challenge by: Alexandra Skelly We're continuing with DS43's challenges so over to Alex  t o explain the her challenge.  _____________________________________ At Preppin' Data we use a number of (mock) companies to look at the challenges they have with their data. We're going to focus on our own supermarket: SuperBytes. The shop has introduced a new loyalty card scheme.  In the first task we need to clean up a number of data fields to determine the percentage of Free Byte qualifiers. Our stakeholders would like one dataset focused on the percentage of customers (split between male and females) that have qualified.  Input There is one input file: Requirements Input the data Create the Loyalty Points: For every £50 spent they get 1 loyalty point Round Loyalty Points to 1 decimal place Create a new field to categorise the Loyalty Points: Points that are greater than or equal to 7 categorise them as "MegaByte"  Points that are greater than or equal to 5 (bu...

2024: Week 20 - Solution

Image
Solution by Tom Prowse and you can download the workflow here .  Step 1 - Combine Tables  Our first task is to combine both of the input tables so they are in a single table. When inputting both tables into the workflow, we need to update the field names within the Customer Spending table so that the Name & Name-1 fields become First Name & Last Name.  We can then join the tables together with an inner join on First Name and Last Name from each table.  After removing any fields that we no longer require the table should look like this:  Step 2 - Pivot Data Next we want to change the shape of the data so that we have a row for each Online or In Person instead of columns.  We can pivot the data using a Columns to Rows pivot where we bring both the Online and In Person fields in the pivoted fields.  Then we want to keep only the rows where the pivoted value returns a Yes. This will keep only the fields where the customer spent in person or online....

2024: Week 20 - SuperBytes Customer Data

Image
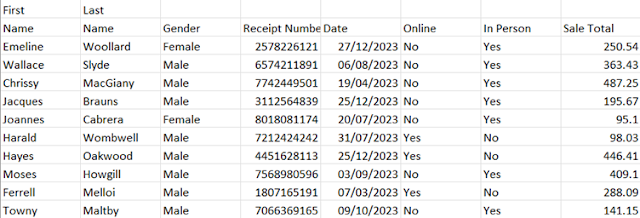
  Challenge by: Saampave Sanmuhanathan We're continuing with DS43's challenges so over to Saampave  t o explain the her next challenge.  _____________________________________ This week we are looking at the customers of SuperBytes. Specifically, Phill Down is interested in which customers spent the most with us on different days of the week last year.  Inputs The input data contains two sheets one with the transaction details of each customer and the other with customer names and customer ID number.  Customer Spending  Customer Names  Requirements Input the data Join sheets the remove names and maintain privacy Group Online and In Person into one field Add a field for the day of the week the transaction was completed Rank sales for each weekday Create a parameter to output a data set for each day of the week Output the data Add day of week to the title of the worksheet Output Monday example output: 7 fields Rank Customer ID Receipt Number Gender O...

2024: Week 19 - Solution

Image
Solution by Tom Prowse and you can download the workflow here . Step 1 - Input Tables The first step is to input all of the tables from the input file. We want to create a union and stack them on top of each other so therefore we can utilise the 'Union multiple tables' functionality within the input step. From here we want to select all of the tables where the file name matches 'SuperBytes Sales_Profits.xlsx' and don't need to work about any wildcard values. As a result we should have the worksheets from various years input into the workflow:  Once the tables are in the workflow, we can rename some of the fields so they match the data that is in them:  F1 --> Quarter Table Names --> Year Then make sure the Year is a whole number. At this stage the table should look like this: Step 2 - Sales & Profit Values We want to ensure that the number values in the Sales & Profits field are formatted in the same way and take into account the string value.  To do t...

2024: Week 19 - SuperBytes Sales and Profits

Image
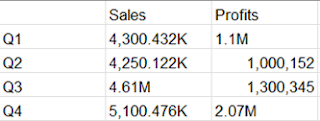
 Challenge by: Saampave Sanmuhanathan We're continuing with DS43's challenges so over to Saampave t o explain the her first challenge.  _____________________________________ This week we are looking at the sales and profit data of Superbytes between 2018 and 2022. The finance department would like to compare the yearly sales and profit of the store. Inputs The input data consists of 5 sheets corresponding to each year (between 2018 and 2022). Each sheet includes sales and profit by quarter of each year. 2018 table There are 5 sheets in total with the title of the sheets according to the year the data was collected. Requirements Input the data Union tables together We want to remove the units from the sales field to convert the data type to the whole number Repeat this process for the profits field Aggregate sales and profits by year Output the data Output 3 fields Year Sales Profits 5 rows After you finish the challenge make sure to fill in the  participation tracke...

2024: Week 18 - Solution

Image
Solution by Tom Prowse and you can download the workflow here .  Stage One Step 1: Animal & Plant Details First we need to input the Animal Details and Plant Details tables and combine them by using a Union step. We can then ensure that all the fields are correctly mapped by using the selections in the Union tool.  The miss-matched fields that need to be combined are Animal & Plant and Status & Stattus. These can be selected and then added together by using the + symbol.  We can then rename any fields and remove fields that we no longer required. The table should look like this:  Then using the Table Names field we can extract whether the row of data is related to an Animal or a Plant. In this case we can utilise the automatic split functionality where Tableau Prep identifies the part of the string that we want to extract and creates a new field for Animal or Plant.  We can then focus on the Class field to extract the English name instead of the Lati...