2024: Week 19 - SuperBytes Sales and Profits
Challenge by: Saampave Sanmuhanathan
We're continuing with DS43's challenges so over to Saampave to explain the her first challenge.
_____________________________________
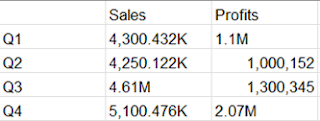
This week we are looking at the sales and profit data of Superbytes between 2018 and 2022. The finance department would like to compare the yearly sales and profit of the store.
Inputs
The input data consists of 5 sheets corresponding to each year (between 2018 and 2022). Each sheet includes sales and profit by quarter of each year.
 |
| 2018 table |
There are 5 sheets in total with the title of the sheets according to the year the data was collected.
Requirements
- Input the data
- Union tables together
- We want to remove the units from the sales field to convert the data type to the whole number
- Repeat this process for the profits field
- Aggregate sales and profits by year
- Output the data
Output
- 3 fields
- Year
- Sales
- Profits
- 5 rows
After you finish the challenge make sure to fill in the participation tracker, then share your solution on Twitter using #PreppinData and tagging @Datajedininja, @JennyMartinDS14 & @TomProwse1
You can also post your solution on the Tableau Forum where we have a Preppin' Data community page. Post your solutions and ask questions if you need any help!


