Posts

2024: Week 14 - Store Data

Image
Challenge by: Hewan Zewdu For April, one of The Data School cohorts (DS43) are taking over #PreppinData with a set of challenges all based on our new (fake) company SuperBytes - everyone's favourite Supermarket! Over to Hewan for the first challenge of the month.  _____________________________________ This week at SuperBytes there has been a manufacturing issue, and as a result a number of items must be recalled from the shelves! Input There is 1 input Excel file with two sheets. You can download the input from here . Requirements  Input the data tables Identify which recalled items are located in each store Create a field which shows how much money will be lost for each item Then calculate how much money will be lost for each category, and round it to 2 dp Output this first dataset Phill Down (the CEO of SuperBytes) now needs to know how much money each store has lost! Find those values for each store, again rounding to 2 dp. Mr Down has decided that any store that has lost...

2024: Week 13 - Solution

Image
Solution by Tom Prowse and you can download the workflow here .  Step 1 - Input Data The first step is to ensure that we have all of the data that we require from the multiple different sheets within the input. As they all have a similar structure we can use the union multiple tables functionality to input these as a single input. We want to include all of the sheets within the input: Within our input the File Paths field can become our Year field and the table should look like this:  Step 2 - Easter Week Number Now we have all of the data in our workflow we can start to calculate the week number that Easter occurs in each year. To do this we want to duplicate the Sales Date field, and then convert this to a Week Number using the Convert Dates functionality. This will then become our Week Number field.  Then to find the Easter Week Number we can rank these weeks to get the 12 previous weeks that the Easter products have been released. We need to group by Year and use a de...

2024: Week 13 - Easter Sales

Image
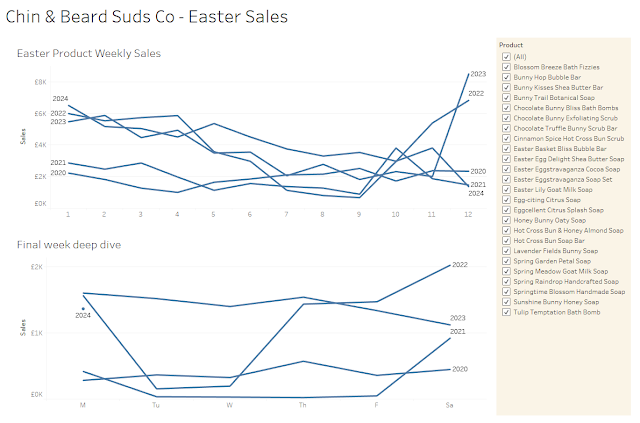
Challenge by: Jenny Martin Chin & Beard Suds Co release Easter themed products each year, 12 weeks before Easter Sunday. Since the date of Easter Sunday changes each year, they have trouble comparing sales to previous years, as the weeks don't line up. They're looking to create the following dashboard to get some insight into their sales in this final week leading up to Easter Sunday.  Inputs We have an Excel extract that contains a sheet for each year that C&BS Co have sold Easter themed products. Requirements Input the data Bring all the years together in a single table Work out the Easter Week Number, as per the first line chart, so the years can be compared Ensure that the weeks begin on a Monday Make sure there is a field for which day of the week each Sales Date is in order to create the 2nd chart Abbreviate these weekday names as above i.e. Monday = M Tuesday = Tu  etc. Add in a field for the Weekday Order so the visualisation can be sorted Monday-Sunday i.e. Mo...

2024: Week 12 - Solution

Image
Solution by Tom Prowse and you can download the workflow here .  Step 1 - Course Dates First we need to calculate when the course starts and ends then build out a table with each of the months in-between. To do this we need to create the course end date to add on the course length from the start date:  Course End DATE(DATEADD('year',[Course Length (years)]-1,[Course Start])) We can then use the Start and End dates to create a new row for each of the months in-between using the New Rows step.  Then finally we can calculate the total amount per year for each of the loan types by using an aggregation step where we group by Loan Type, Amount per Year, and Year:  At this stage our table will look like this:  Step 2 - Loan Dates Now we want to calculate the dates for when the loan has been received. First we can create a date based on the year of study and the 1st September:  Loan Received MAKEDATE([Year],9,1) Then we want to calculate the number of months since ...

2024: Week 12 - Graduate Student Loan Repayments

Image
Challenge by: Jenny Martin Prep Air employees had positive feedback about the Staff Income Tax challenge a couple of weeks ago, so they have decided to carry out a similar exercise for staff on the Graduate scheme.  In England (where Prep Air is based), graduates will begin to repay their Student Loans the April after they graduate. This will be the first time many graduates will see the student loan deduction on their pay slip, so Prep Air wants them to know what to expect. The amount they repay is based off their salary rather than the size of the loan.  More info on gov.uk The graduates at Prep Air are all on Plan 2 student loans, so they pay 9% on anything they earn over the threshold of £27,295. In contrast to when repayments begin, interest on the loan starts accumulating from the day the first payment is made. Interest is applied monthly. We're going to simplify the problem a little and assume that the full loan amount is paid to the student once a year (even though in...

2024: Week 11 - Solution

Image
Solution by Tom Prowse and you can download the workflow here .  The challenge this weeks focusses on manipulating dates so that we add in an additional month to the year so we have 13 months in total.  Step 1 - Every day of year First off we want to create a row for every day of the year. We are given our start and end date within the input, so first we want to remove any Null values then create our date field so that it includes the year:  Date [Date] + "2024" Then we can change the data type to a date so we have a nicely formatted date field. At this stage we should have two rows with two dates - 01/01/2024 and 31/12/2024.  We can then use these dates to create a row for each day between each of these using a New Rows step.  Now we have every day of the year we can then create a field for the Month number and Day of the Year number.  To do this we will duplicate the Date field, then convert this to Month Number using the in-built functionality However, w...

2024: Week 11 - 13 months in a year

Image
Challenge by: Jenny Martin Are you familiar with the argument that there should be 13 months in the year instead of 12 ? 13 months, exactly 4 weeks long, would account for 364 days of the year and then we'd just have an extra 1 to deal with (or 2 on a leap year!)  Naturally, my mind goes to building a workflow that let's me investigate which dates would change months. Naturally, Carl's mind starts wondering what the new month would be called, so do let us know your suggestions! Input Just a small input this week: Requirements Input the data Create a row for each day of the year I've chosen to use 2024 for the challenge so results will be different if you select a non-leap year Calculate the new months of the year such that the first 28 days of the month are month 1, the next 28 days are month 2, etc This will give you 14 months, with the 14th month containing just 2 days Create a new date with the format: New day of the month / New month / 2024 e.g. 20/11/2024 becomes 1...