2019: Week 2
So you survived week one (note: if you haven’t completed week one - go back and give it a go as we will be layering the techniques over time)... well done and let’s kick this up a notch.
This week’s challenge uses a few of Jonathan’s and my favourite Tableau Prep features. Prep has a load of great features built in to the menus so let’s see which of them you can use to save you lots of fiddly calculations.
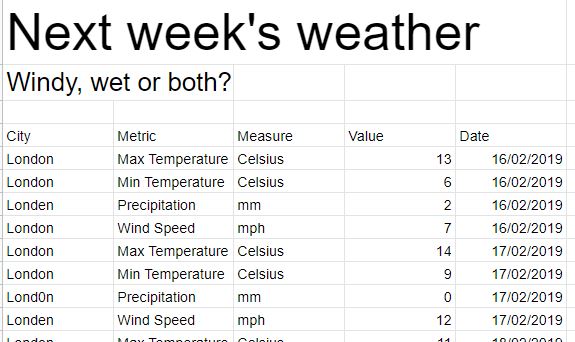
So what’s the data? We need you decide where you are going to in the UK; London or Edinburgh, purely based on the weather (every Brit’s favourite subject).
*edit* - you need to update to at least version 2019.1 or there are some serious work-arounds to be done!
Requirements for this week:
- Import the file
- Get rid of those nicely formatted titles - no-one is viewing this in Excel! (sorry Excel fans)
- Make sure you get all the data in the Excel sheet loaded in to Prep
- Clean up the City names to create two cities in one column (London and Edinburgh)
- Pivot the data to give a measure per column for the four metrics in the data set
- Output the data to csv
Your output file should:
- have 6 columns
- have 14 rows of data and a row of headers
- Have no cells without a value
- Just load beautifully into Tableau
For comparison, here's our output file. Don't to forget to fill in our participation tracker!


