How to... Aggregate in Prep Builder
Prep Builder helps Tableau users prepare their data for fast, agile visual analysis in Tableau desktop due to the look and feel being so familar. That is until so of the common features of the tools differ. When I'm teaching Tableau Prep Builder, aggregation is a common source of that pain.


To write our total (to sum up each of our Item's Total Costs) we would write this calculation:
 In Desktop, if you've used the tool for a while, you'll probably know that if you add an aggregation to your calculation, Tableau will add up all those values based on what discrete fields (the blue pills!) are within your view.

As we don't have any discrete fields in our view, then Desktop simply sums up all of our Item's Total Costs. The equivalent in Excel looks like this:

But in Prep Builder, the Sum function doesn't exist within Calculated Fields!
 The reason for this is because we need to tell Prep what to sum up and to what level of granularity. In Desktop, Tableau determines this by our discrete fields in the view (placed on the Columns or Rows shelf or used on the Marks Card). Here we have put Type of Item on to the Columns Shelf so Desktop is now summing all the Total Costs for each Type of Item together.

This gives the user a huge amount of flexibility and is why Desktop allows for exploration of data so easily. You'd only use Prep to create this aggregation when you know what level of granularity you want to make so we set this up using the Aggregation Step rather than a calculated field.


The equivalent in Excel is the same as summing the whole end column:

What is Prep Builder doing similar to Desktop calculations?
Like Desktop, Prep Builder will work each calculation out at a row level if you don't use any form of aggregation. For example, if I wanted to work out the Total Cost in this simple dataset, I am simply adding one value to the other, one row at a time: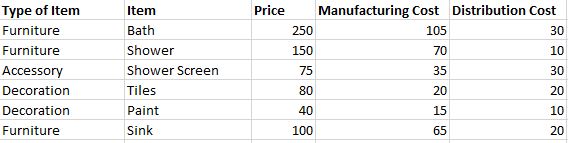
The dataset is here as an Excel workbook if you want to use it
To add these costs together, we would write the same calculation in Prep as we would Desktop:

This results in each of the values getting added together for each row, with a new column being created to hold that value:
The value created and the additional column to hold the value is identical between the two tools. For heavy Excel users who haven't used a tool that works with columns, the approach is the same in Excel to form this value, you are just selecting which cells get added together rather than the column names in Tableau.

For any calculation in Prep that doesn't involve any aggregation, you are going to be doing 'row based' calculations. This means that the calculation will occur, in turn, on each row of you data set.
What differs with calculations in Prep Builder?
So if our 'row based' calculations are the same in both Prep and Desktop, which aren't? You've probably guessed, those calculations where you are aggregating multiple rows together in the same column.To write our total (to sum up each of our Item's Total Costs) we would write this calculation:
As we don't have any discrete fields in our view, then Desktop simply sums up all of our Item's Total Costs. The equivalent in Excel looks like this:

But in Prep Builder, the Sum function doesn't exist within Calculated Fields!


This gives the user a huge amount of flexibility and is why Desktop allows for exploration of data so easily. You'd only use Prep to create this aggregation when you know what level of granularity you want to make so we set this up using the Aggregation Step rather than a calculated field.
So how does the Aggregation step work?
Before we dive in to the How, let's make sure everyone can create their aggregation step. To add an aggregation step click on the plus sign at the end of your flow (or wherever you want to add it) and select 'Add Aggregate':
Let's familarise ourselves with the basic Aggregation step set-up pane:
The grey panel on the left has all the fields in your data set and their 'default' aggregation based on their data type. The way to configure this tool is to drag the fields you want to aggregate and 'Group By' (don't worry I'm getting to what this means). You can change the aggregation by clicking on the current type of aggregation (ie 'SUM') at the top of the column once it is in the Aggregated Fields part of the pane:

If you haven't used SQL or other data coding languages then the concept of 'Group By' might be a bit strange at first. My simple rule is that by adding a field in to Group By is the equivalent of saying:
"For each of these 'things', I want the Aggregated Value to be returned". If you have multiple fields in the Group By then this means you get an aggregated value for each combination of the grouped by fields.
To help that make sense, let's look at a few examples with our Bathroom data set:
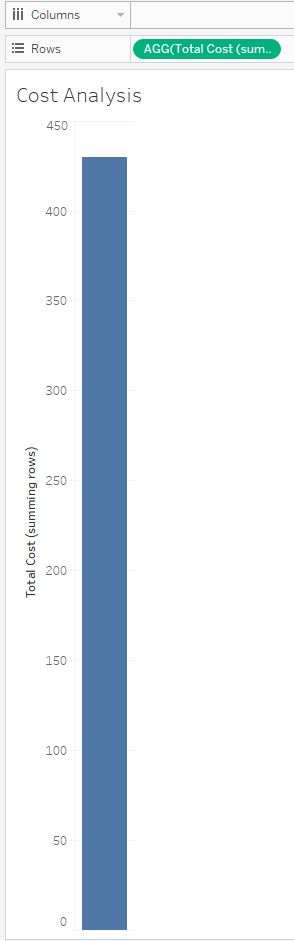
1. Group By: Nothing, Aggregate: sum(Total Cost)
By not adding anything to the group by, Prep will aggregate the data however you've asked for it. For this example, by Summing Total Cost, Prep adds up all the Total Costs in the dataset.
By not adding anything to the group by, Prep will aggregate the data however you've asked for it. For this example, by Summing Total Cost, Prep adds up all the Total Costs in the dataset.

The equivalent in Excel is the same as summing the whole end column:

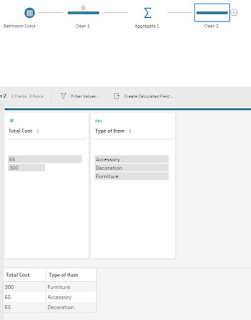
2. Group By: Type of Item, Aggregate: sum(Total Cost)
By adding Type of Item, we are asking Prep to sum up the Total Cost for each different Type of Item in our data set.
 Notice how the data set has three different Types of Items and therefore, there are three rows of data shown at the bottom right of the screen. The Profile pane, has only two values as one of those values are the same (65) in our output.
In Excel, here is what is going on:

If a different, new Type of Item came in to the data set, the next time it is run, Prep would create a fourth row of data

In Excel, here is what is going on:

If a different, new Type of Item came in to the data set, the next time it is run, Prep would create a fourth row of data
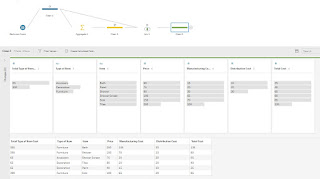
3. Group By: Type of Item, Item, Aggregate: sum(Total Cost)
If we Group by each categorical data field in our view (ie Type of and Item) then you will bring back exactly the same as what we fed in to the start of the Aggregation step:

In this example, this aggregation isn't actually aggregating anything as the unique combinations or Type of Item and Item are exactly the same. Therefore, we get as many rows flowing in to the step as what flows out (thus it's a pointless step for this dataset!)

In this example, this aggregation isn't actually aggregating anything as the unique combinations or Type of Item and Item are exactly the same. Therefore, we get as many rows flowing in to the step as what flows out (thus it's a pointless step for this dataset!)
Where's all the rest of my data gone?
You're now clear on what is happening in your aggregation step but let's look at what happens next. Following you aggregation, you might have additional preparation steps that you need to conduct. The challenge with the aggregation step is that you only output what is in your Group By and Aggregation set-up.
Let's go back to the second Group By example where we are grouping by just Type of Item and see what flows in to the next Clean step:

We only have 3 different Types of Item so therefore, we only have three rows of data but notice how we have left all the different columns of data too. To get these back, then you need to join on the Total you have just formed to the original data set. Your flow will look like this:

To add the Total value to your existing data, then use a join condition(s) of whatever is within your Group By part of your aggregation. This will allow you to produce so '% of Total' calculations.
As this blog post is now way too long, I will write a separate post about this join technique at another time.
Happy Preppin'!!
________________________________________
________________________________________
If you want to practice these skills, here are some of the challenges that relate to this subject:


