How to...Pivot
Growing up in the 90s, one word instantly draws to mind an image in my head. The word is Pivot and the image is:


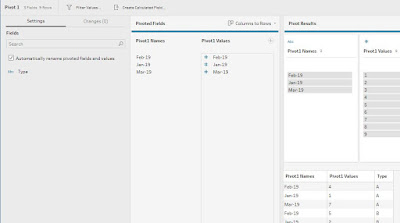


image from: Growth Hackers
So why do we need to understand about pivoting data (not sofas in stairwells) for data analysis?
When do we need to Pivot in Tableau Prep?
Tableau Desktop needs the data to be in structured columns. Each column can hold one type of data and can then be used on either shelves or cards in Desktop to alter the view on screen.
For example, a common need for pivot is when a new column is added for each new date in a data set.

The reason why this data structure isn't great in Tableau is two-fold. One, if I want my dates to form an x-axis, they can't with this data structure as I need one data field (column) to hold all the different dates and another column to hold all the relevant values for each of those dates. Secondly, if the file is updated, Tableau won't automatically add the new column in to your analysis. If the new data appeared as additional rows then this would be included in the view (as long as Desktop is able to read the underlying data).
There are two types of pivot in Tableau to select from:
- Columns to Rows
- Rows to Coumns
Pivot Type 1 - Columns to Rows
To solve the date situation above, we need to change the columns in to rows of data instead. Therefore, after you add a Pivot step to you need to select what type of pivot you want to do:

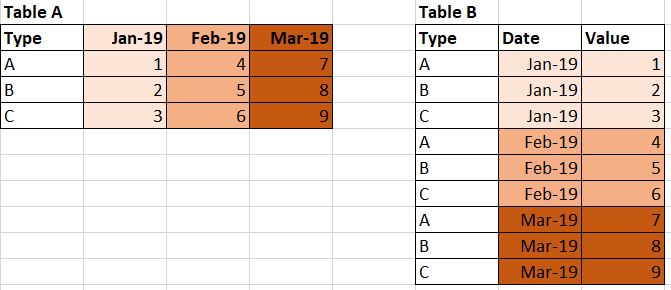
The equivalent in Excel is to transform Table A in to Table B:
So how do you achieve this result in Prep with the Pivot step?
Step A: Add Pivot step. All the Fields (columns) in your data set will be listed in the left-hand pane.

Step B: Select the fields you want to have pivoted from columns in to rows of data instead. You can use CTRL key (or CMD for Mac users) to select multiple fields. Once selected drag those fields to the middle pane in this image as shown.

Step C: Your data is now pivoted and you can see the results in the bottom right hand corner of the screen.

Step D: Rename your columns to match your data by double-clicking on the field name.

Pivot Type 2 - Rows to Columns
Rows to Columns came to Prep Builder in a later version of the tool but is a welcome addition to avoid a work around for a common task. Often data will come from sources where multiple measures or dimensions are held in a single column. To make analysis easier in Tableau Desktop, you will need to seperate these out in to an individual column per measure / dimension.
Here's what the manipulation looks like that we want to achieve:


Step B: Drag the column that you want to be the new column headers in to the top part of the middle pane - called 'Pivoted Fields'

Step C: Add the column that you want to form the values under those column headers.

Here's what the manipulation looks like that we want to achieve:

Step A: Change the type of pivot to 'Rows to Columns'

Step B: Drag the column that you want to be the new column headers in to the top part of the middle pane - called 'Pivoted Fields'

Step C: Add the column that you want to form the values under those column headers.

You will need to choose how multiple rows will be aggregated together. The aggregation will happen at the level of whatever is left out in the left-hand pane of the step. This is the equivalent of a Group By (see the How to... Aggregate post) for the fields on the left-hand pane.
Getting used to pivoting data is a key skill in data preparation so practice makes perfect!


