How to...Clean by Grouping Data
Data preparation would not be necessary if we were to always have someone else curating a perfect data set for us. Sadly (and more empoweringly) we can do this ourselves and often have to. One of the common challenges we face in data prep is cleaning up string data (so much so we wrote a post about that here). One of the challenges with string data is making them consistent to be able to count how many of the same entities we have or be able to create implied relationships between the entities in the form of hierarchies. One technique is required to meet this challenge than any other... Grouping.


 ...select 'Group' and the grouping will be formed. However, be careful as the first data value you select will become name of the group. This is easy to amend if you do select the incorrect one first as simply double clicking on the value will enable you to rename it.


Replace functions will replace a character in a string data value with the other captured within the calculation. Here, the Replace function will remove an 0's (zeros) found in the data values and replace them with o's (lower case o).

Here is an exercise to test the techniques above:
What do we mean by 'Grouping'?
Grouping is the technique where we apply logic to string data fields to recognise that those strings have a common characteristic. For example, we might expect the following data items to be grouped together:
Reorganisations used to be a nightmare to handle from a data perspective. The organisation decides to change management structure or restructure a few team's sales territory but the data team (*waves*) are very often not part of the inner circle knowing these things. Strangely, reports / analysis are often requested straight away for the management team picking up less known teams and functions. To restructure the organisational hierarchy often takes too long to build significant and robust reference tables. Therefore, grouping allows us to ad-hocly handle these challenges in the short term until reference tables are built.- Edinburgh
- Edenburgh
- Edinborough
- 3d!nburgh
As humans, we can see that the spellings of the different names should probably all read Edinburgh (especially if the column was called 'City Name'). But data software does not see this the same way. We have to tell the software to think about these different collections of characters in very different ways.
Where would we use Grouping?
Grouping is a technique we need to learn for multiple reasons:
1. Cleaning
When we think of data, most people seem to think about system generated data being fed in to databases. After a year of data analysis, most data workers would consider themselves lucky to work with such data. Most data sources people use are still manually pulled together. Even leading Equity Research agencies use manual input of Corporate results from pdfs to form the data sources for their analysis and therein lies the issue.
As soon as data is entered manually, the chance to miskey a letter or number becomes all too easy. Add in modern day time pressures to this mix and you are looking at a very messy data set to analyse what is happening. If you haven't invested in the automatic generation of data, you probably don't have a heavily resourced IT team who will clean up those mistakes. Grouping is a way of grouping together incorrect and correct options together to form a fully correct data set.
2. Hierarchy
“Drilling” in to data is a common term you are likely to encounter as you work in data. This refers to starting at a high level view of the data (less granular) and focusing on more and more granular views of the data, often by filtering out what is not of interest so as to not overburden the analyst. Hierarchies in tools like Tableau, allow the user to do exactly this but the hierarchies aren’t always set within the data. To build higher levels or intermediary levels between existing data fields in your data set, groups can be used. Common hierarchies can include:
- Time
- Geographical
- Organisational
- Operational processes
Groups can be used to pull together lower level entities into a higher level to act as the starting point of the analysis for allowing the analyst to drill in to the data. The flexibility of grouping techniques can mean that analysis can be updated quickly in response to organisational changes like a Merger or simple restructure of teams / managers.
3. Reorganisations
Grouping Techniques
1. Manual
Manual grouping is great for a simple, quick fix. However, for a larger, more complex challenge, this technique will soon become frustrating.
Manual grouping allows us to apply our own logic to a data set. Therefore, whatever your logic, you will apply it by often selecting data points to group together.

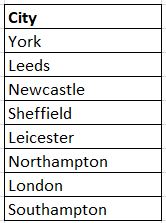
Clearly we want to make the second row of data the same as the rest of York. Each tool will have their own methods for this but for Tableau Prep Builder, the solution is very simple. Firstly, Prep allows the user to use the Profile Pane to quickly see odd values in the data set.

Dealing with the issue is just as easy. Firstly select the values you would like to clean / amend by holding down the CTRL (or the Control on Mac) key...

...Right click to bring up the menu...


When you edit the group (which you can do from the Changes Log), you can see what data values have been grouped together. This grouping shows how any data values that match the strings grouped together will also be grouped.

2. Calculations
There are many ways to clean data values with calculations but to group the data values with their clean selves is normally accomplished with a couple of techniques.
IF statements is a type of Logic statement. Logic statements are commands to tell the software to work through a series of steps. In this example, the calculation is matching the incorrect name for York and converting any values that meet that criteria to 'York'. If the value isn't 'Y0rk' then the calculation simply returns the value that already existed in the field.

Remember, if you call the new calculation the same name as the original data field, the calculation will overwrite the old values with the values formed form this calculation.
Replace functions will replace a character in a string data value with the other captured within the calculation. Here, the Replace function will remove an 0's (zeros) found in the data values and replace them with o's (lower case o).

Whilst IF statements can be built up with many conditions (the longest I have written is 78 conditions), this quite an arduous way to complete this work. For each new variation found that needs to be replaced requires another condition. Replace statements can help here if only certain characters need to be removed. Any alphanumeric character that requires to be replaced, can't exist in any other string. This technique is fine in our example as we don't require any of the town names to have a zero but if we were to have a 'e' instead of an 'o' in York then we wouldn't be able to replace that character without affecting Leeds.
3. Built in Functionality
Some Data Preparation tools have their own built in capabilities to support cleaning data by grouping similar strings together. Tableau Prep has pulled together many of the best capabilities and made it very easy for the user to utilise. There are three additional forms of grouping
a. Pronunciation - based on how the string would sound if spoken in English. Similar pronunciations are grouped together
b. Common Characters - letters are analysed and sorted in to an order. Similar ordered strings are then grouped together.
c. Spelling - uses the differences in characters used in strings to work out the value of changes required to spell the terms similarly.
Here is an exercise to test the techniques above:


