How to...Scaffold your Data
Scaffolding is a term that you may not come across often, but the challenges the scaffolding technique resolves is increasingly found in modern data problems.

This all changed when Bethany Lyons presented at a Tableau Conference a few years ago. Bethany presented a technique in Tableau Desktop that solved many of these challenges by breaking the logic that a dataset that needs to be scaffolded to create extra records for each date needs to be scaffolded with a date scaffold. Instead of the Traditional Method detailed above, the new technique utilise different date calculations to follow a similar method but all created from simple integers. In the mobile phone operator example, the longest contract length is 24 months so the scaffold would require a column of integers of 0 to 23.

Let's look at the differences of this technique and why it removes the issues covered above:
Step 1 - Input
Both datasets will be input as before.
Step 2 - Join the Datasets
This time, there is no need to use the 1 = 1 Join Condition as the Join Condition can be set as 'Scaffold' < 'Contract Length'. This means that a Scaffold Row will be assigned to each Subscription up to where the Scaffold number is the same as the Contract Length. This works as the values in the Scaffold start at 0 (we'll get to that shortly).

Notice how the number of rows required is already correct so there is no need to filter later in the flow. This is a massive advantage when you have thousands or millions of customers so millions of rows are not formed, only to be removed straightaway.
Step 3 - Form Reporting Date
In the previous technique, the Scaffold Date became the date used for reporting. As no such date exists this time round, we need to form it. DateAdd() is used as the Start Date gives the first date and then the scaffold value acts as the increment on top of this.

As the first scaffold value is zero, then no additional increment is added on to the Subscription Start Date. Any subsequent increment adds the level of date part applied. In the mobile phone operator example, the payments are monthly so we set the dateadd() level as 'month'. Another advantage of this technique is the actual date returned is much more likely to be when the revenue is actually obtained by Subscription provider.


What is Scaffolding?
Scaffolding is a technique of filling missing rows of data within a dataset to assist analysis. A dataset may appear complete with no nulls and a record for each individual entity but still not be suited for the analysis you wish to conduct.


Consider a mobile phone operator who wishes to analyse their revenue that will be gained each month from contracted customers. The data the operator is likely to have is a record of the customer, when the contract starts, how long the contract is due to last and how much the monthly cost is. However, if monthly revenue is sought to be analysed to understand how much revenue will be gained each month, there is no date to determine this value. The only dates to use for analysis are the contract start date and end date. If the contract was for two years, there would be twenty-two records needed to gain the full insight.

Scaffolding is the answer to this process. The technique adds an additional row for each of the 'missing' records that are required for the analysis. In the mobile phone operator example, a scaffold would create the additional rows so each monthly payment would have it's own record. This will allow analytical software, like Tableau Desktop, to show the full revenue over time.
What are the Challenges Scaffolding addresses?
There are many challenges that the Scaffolding techniques meet but those numbers are growing rapidly due to subscription pricing. Subscription pricing is where the consumer pays a regular, often smaller amount, on a regular basis rather than a large initial purchase. Subscription music, software or food packages are increasing the way many purchases are being made creating a bigger need for any data analyst to be able to work with subscription data.
The scaffolding technique does add the additional rows of data required for analysis but creates a number of other challenges that should be considered:
Size of data
The most significant issue is that this technique will multiple the size of the dataset you are analysing considerably. This poses challenges for:
Retention
Reporting on revenue that has not happened yet can be presumptuous. Just because a customer signs up to a subscription based product, doesn't mean that they will maintain those payments due to affordability or changing needs. Being able to remove rows of projected revenues or determining levels of retention and applying the drop off of those customers takes a lot of thought.
Inflation / Exchange rates
Depending on the increment of time the subscription is over, factors like inflation or changing exchange rates should be considered and applied to accurately represent the value of the revenue earned. Projecting these is an art in their own right, but applying common forecasts can improve the value of the analysis greatly. Often projections will be held in a secondary reference table and needs to be joined on to the original data set along with the scaffold.
The scaffolding technique does add the additional rows of data required for analysis but creates a number of other challenges that should be considered:
Size of data
The most significant issue is that this technique will multiple the size of the dataset you are analysing considerably. This poses challenges for:
- Storage of data - the larger the dataset, the greater the amount of storage that you will need to have for the dataset.
- Computing power - not everyone has a brand new, powerful computer to use. Adding the huge number of rows to potentially an already large dataset can really test the working memory of your computer too.
Retention
Reporting on revenue that has not happened yet can be presumptuous. Just because a customer signs up to a subscription based product, doesn't mean that they will maintain those payments due to affordability or changing needs. Being able to remove rows of projected revenues or determining levels of retention and applying the drop off of those customers takes a lot of thought.
Inflation / Exchange rates
Depending on the increment of time the subscription is over, factors like inflation or changing exchange rates should be considered and applied to accurately represent the value of the revenue earned. Projecting these is an art in their own right, but applying common forecasts can improve the value of the analysis greatly. Often projections will be held in a secondary reference table and needs to be joined on to the original data set along with the scaffold.
What was the traditional technique?
The scaffolding technique has been used for a long time. Originally, a technique using a scaffold of all possible values was often used. For example, using the mobile phone operator example, each month from the original start date of the earliest customer in the dataset, through to the last month of the contract for the latest customer would need to be created.

The image above covers the mobile phone operator example as the longest contract starts in January 2019 and runs 24 months. The latest date needed is December 2020. Just having the date range required isn't sufficient enough though. This scaffold needs to be joined to the customer data. To do this, there are two options:


The image above covers the mobile phone operator example as the longest contract starts in January 2019 and runs 24 months. The latest date needed is December 2020. Just having the date range required isn't sufficient enough though. This scaffold needs to be joined to the customer data. To do this, there are two options:
- Create a calculation that defines the last month of the contract as 'End Date' and then join based on Start Date >= Scaffold Date and End Date <= Scaffold Date.
- Create a condition that will Join each row in each dataset to each other. This can then be filtered to remove any excess rows. The calculation that's easiest to join is just the number '1'. Create this calculation in each dataset and join on a condition where 1 = 1 (ie every row joins to every other row).
The second join condition using 1 is easier to follow as the user can see the results of the join and filter to ensure each aspect is correct. Let's follow that approach, using the mobile phone example:
Step 1 - Input
Input both of the dataset (the Subscription Data and the Scaffold)

Step 2 - Form Join calculations
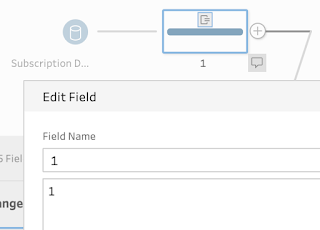
Form a calculation in a 'Clean Step' of the value 1 (for ease call the calculation 1 too).

Repeat for both inputs.

Step 3 - Join the two datasets together
Using a Join Step, connect the two flows together using the Join Condition of 1 = 1 for an Inner Join.

This results in each of the rows of a customer record from the Subscriptions Data being added on to each date. Prep makes seeing the results of this join clearly in the lower part of the Join configuration pane:

As there are 3 subscriptions recorded and 24 dates captured, the join results in 72 rows of data being formed (ie 3 x 24).
Step 4 - Filter the unnecessary rows
To be able to filter out any rows that would start before the Subscription, or occur after the end of the contract, we first need to form a calculation for the 'End Date'. Add a new 'Clean Step' and create a new calculation:

This will form a new field in your data and is easy to check it has worked as intended in the Profile Pane of Prep.

Once you have the 'End Date' of the subscription, you can then filter out that dates that have been added by the scaffold that sit out the Start Date and End Date of the Subscription. The calculation below uses 'datetrunc()' as a function to allow you to set the frequency of the scaffold. As this dataset is a monthly, we can ignore the day of the month as the revenue you will occur in the month when the contract is started and each month until the end of the contracted term.

A filter within a 'Clean Step' in Prep must return a Boolean result. The records that meet the condition set, thus returning a 'true' value, will continue to be included in the dataset. Those that do not meet the condition set in the Filter will be removed from the flow leaving one row per month of revenue, per subscription.
What is the newer technique?
Whilst this technique will work, it does have a number of issues that can arise over time. The most notable of these is that the list of dates in the Scaffold has to be maintained and updated. This doesn't sound too problematic, but remembering where the file is kept, remembering to update it and remembering to ensure your colleagues also know how to do this (in case you leave).This all changed when Bethany Lyons presented at a Tableau Conference a few years ago. Bethany presented a technique in Tableau Desktop that solved many of these challenges by breaking the logic that a dataset that needs to be scaffolded to create extra records for each date needs to be scaffolded with a date scaffold. Instead of the Traditional Method detailed above, the new technique utilise different date calculations to follow a similar method but all created from simple integers. In the mobile phone operator example, the longest contract length is 24 months so the scaffold would require a column of integers of 0 to 23.

Step 1 - Input
Both datasets will be input as before.
Step 2 - Join the Datasets
This time, there is no need to use the 1 = 1 Join Condition as the Join Condition can be set as 'Scaffold' < 'Contract Length'. This means that a Scaffold Row will be assigned to each Subscription up to where the Scaffold number is the same as the Contract Length. This works as the values in the Scaffold start at 0 (we'll get to that shortly).

Notice how the number of rows required is already correct so there is no need to filter later in the flow. This is a massive advantage when you have thousands or millions of customers so millions of rows are not formed, only to be removed straightaway.
Step 3 - Form Reporting Date
In the previous technique, the Scaffold Date became the date used for reporting. As no such date exists this time round, we need to form it. DateAdd() is used as the Start Date gives the first date and then the scaffold value acts as the increment on top of this.


Step 4 - Remove the Scaffold value
Deleting the Scaffold Value by removing the data field from the dataset after the Reporting Date is formed means it won't be mistakenly used by a user of the dataset.
The Result
The visualisation of all monthly revenues can be formed easily in Tableau Desktop after outputting the data. Here, the Customer ID has been added so the effect of the multiple rows (one per month) of the scaffolding can be easily seen.

Scaffolding can now be applied easily to any dataset that may not have full monthly records. This is a technique that has empowered a lot of analytical solutions that would not have been formed otherwise.
__________________________________________________
Want to test your scaffolding skills, try these Preppin' Data weekly challenges:


