2020: Week 9 Solution
This week we offer two solutions: one for if you have version 2020.1.3 and one for earlier versions - we used 2019.3.2. You can view the full workflows below or use the following links to download them:
 |
| 2019.3.2 Solution |
| 2020.1.3 Solution |
Both flows begin with the same preparation steps so we will indicate when our solution post splits for each specific version.
1. General data preparation

This section is for both versions and includes:
- Removing the averages.
- Calculating the sample types.
- Cleaning up the dates.
- Pivoting the candidates.
- Removing the null results.
It is after pivoting the candidates that the solutions for each version diverge.
1.1 Removing the averages
Within a Clean step, locate the "RCP Average" value within the [Poll] field.
Right-click on it and select "Exclude".
1.2 Calculating the sample types
In the [Sample] field, each value ends with either "LV" or "RV".
These do not refer to insurance companies and motor-homes but instead to whether the poll results are for "likely voters" or "registered voters".
There are number of different ways of creating a new [Sample Type] field containing these labels, none of which are wrong however we opted to use a single calculated field with a CASE statement and the RIGHT() function:
[Sample Type]
|
CASE RIGHT([Sample], 2)
WHEN "LV" THEN "Likely Voter"
WHEN "RV" THEN "Registered
Voter"
ELSE "Unknown"
END
|
By checking the two right-most characters in the [Sample] field we can assign the [Sample Type] label appropriately.
1.3 Cleaning up the dates
To clean up the dates and obtain the [End Date] field we need to convert the second half of the [Date] field into an actual date. A good starting point is to extract this section using a Custom Split so we can make our future calculations simpler.

By opting to split on the last 1 space we successfully get the end day and month for each poll.
Before we convert this day and month to a date, we need to be careful as some polls are in 2019 whilst others are in 2020. As these polls have all taken place recently it is safe to assume any results with an end date in December aren't somehow predicting the future but instead refer to 2019 results.
To reflect this, we use CASE statement and the LEFT() function to create a [Year] field.
[Year]
|
CASE LEFT([Date],2)
WHEN "12" THEN "2019"
ELSE "2020"
END
|
By checking if the month part of [Date] is "12", i.e. is in December, we can assign the appropriate label.
Finally, we can create our actual [End Date] field using the DATEPARSE() function to combine and convert the [Year] and [Date] fields.
[End Date]
|
DATE(
DATEPARSE(
"yyyy/M/dd"
,[Year] + "/" + [Date]
)
)
|
In this calculation we concatenate [Year] and [Date] separated by a "/" and then let Tableau know how this string should be converted to a date using the "yyyy/M/dd" input.
1.4 Pivoting the candidates
We know our final output needs rows containing the results for every candidate, [Poll], [Sample Type], & [End Date]. However, our current data has our poll results in a column per candidate. To fix this, we can use a Columns to Rows pivot.
Drag all of the candidate fields into the pivoted fields area. Then rename [Pivot1 names] to [Candidate] and [Pivot1 Values] to [Poll Results]. We now have our data structured correctly.

1.5 Removing null results
Our final prep before the solutions diverge is to remove null results. After pivoting the candidates, right-click the "null" value in the [Poll Results] field in the profile pane and select exclude.
From this point, keep reading for the rest of the pre-2020.1.3 and click here to jump to the rest of the 2020.1.3 solution.
Pre-2020.1.3
2. Rank & Spread
This section will cover:
- Using the self-join & aggregate trick to calculate the rank.
- Using filters and aggregation to get the points for 1st and 2nd place
- Calculating the points spread and appending it back to the full data.
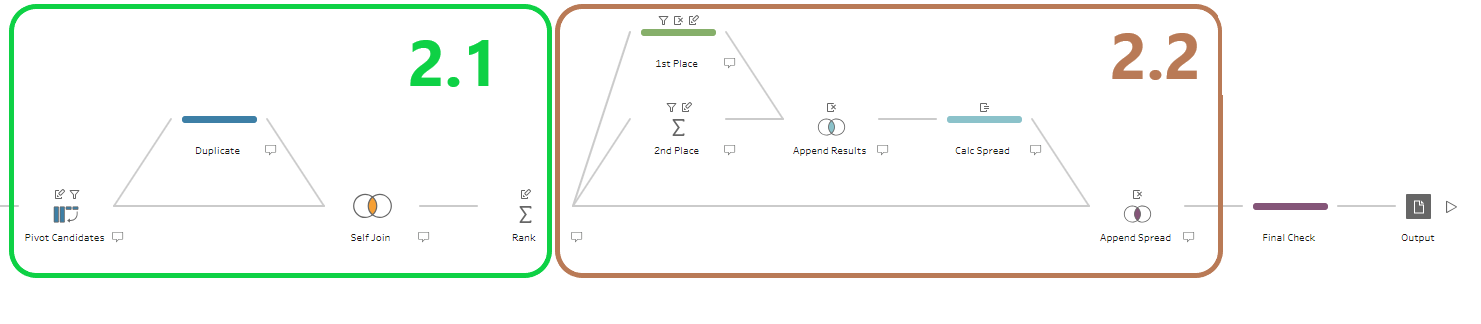
2.1 Calculating the rank
As we do not have access to any table calculations or LODs, we need to use the self-join trick described in many previous challenges.
First duplicate the data in a empty Clean step. Then, join it back to the pivoted data. We want to rank the candidates within each [End Date], [Poll], and [Sample Type], so we need to use the following join conditions:
- [End Date] = [End Date]
- [Sample Type] = [Sample Type]
- [Poll] = [Poll]
- [Poll Results] <= [Poll Results]
This will join every candidate within a poll subset to every candidate with better score than them. This means that the candidate with the best result will join only to themselves and have one row. Second place will join to the first candidate and themselves and have two rows, and so on.
This means we can now aggregate to rank the candidates by counting how many rows there are for each of them. The aggregate settings for this are:
- GROUP on:
- [Candidate]
- [Poll Results]
- [End Date]
- [Sample Type]
- [Poll]
- SUM up:
- [Number of Rows] (and rename to [Rank])
The important caveat here is that this provide a Modified Competition ranking ("1,3,3,4"). This means that if the candidates in 2nd place have the same [Poll Results] then they will be ranked joint 3rd instead of joint 2nd.
2.2 Calculating the spread between 1st & 2nd place
The general method we've opted for in our solution is to extract the points for 1st place, then extract the points for 2nd then, then append these results to the end of each row before using a calculation to subtract one from the other.
The area where care is required is extracting the points for 2nd place. In some polls 2nd place is actually joint 3rd, so we need to figure out when this situation has occurred and instead pull in the points for joint 3rd.

2.2.1 Getting the points for 1st place
Create a branch from after we calculated the rank by creating a new clean step. In this new clean step we want to keep only the rows for the 1st place candidates. In the [Rank] field in the profile pane, right-click the "1" value and select "Keep Only".Before moving on, rename the [Poll Results] field to [1st Results] so we can more easily keep track of which poll results are which when we join them together.
2.2.2 Getting the points for 2nd place
Create a second branch from after we calculated the rank, but this time use an aggregate step. The aggregate step will help us return the 2nd highest ranked candidate, whether that be 2nd or 3rd.
Before doing any aggregation, right-click on the "1" value in the [Rank] field and select "Exclude".
To figure this out, we can use the following settings:
- GROUP on:
- [End Date]
- [Sample Type]
- [Poll]
- Take the MIN of:
- [Rank]
- Take the MAX of:
- [Poll Results]
Taking the MIN of [Rank] will return the candidate for each poll who had the next best results after 1st place. Similarly, taking the MAX of [Poll Results] will return the actual associated results for this candidate.
Before moving on, rename the [Poll Results] field to [2nd Results] so we can more easily keep track of which poll results are which when we join them together.
2.2.3 Joining the results together
Now that have the points for 1st and 2nd place in two different steps, we need to join them together so we can calculate the spread.
To do this, use the following INNER join settings:
- [End Date] = [End Date]
- [Poll] = [Poll]
- [Sample Type] = [Sample Type]
We now have [1st Results] and [2nd Results] on the same row for each poll.
2.2.4 Calculating the spread
To calculate the spread, create a new calculated field which subtracts [2nd Results] from [1st Results]:
[Spread from 1st to 2nd Place]
|
[1st Results] - [2nd
Results]
|
2.2.5 Appending the spread back to the full data
Finally, we just need to join the spread for each poll back to the full data. This join is exactly the same as the one above, however it is between our rank aggregation step and our final spread calculation step.
With that done, all that is left is to check over the results, arrange the fields as desired and output using an output step!
2020.1.3
 3. Rank & Spread

With the introduction of table calculations and LOD (level-of-detail) calculations into Prep we can now streamline many of our workflows from requiring multiple aggregation and join workarounds to simple, single calculations.
For a more in-depth look at using LODs and table calculation is Tableau Prep you can read our How To... Do Analytical Calculations guide.
This section will cover:
- Using a table calculation to calculate the modified rank.
- Using LODs to calculate the poll results for 1st & 2nd place.
- Calculating the spread between 1st & 2nd place.
3.1 Calculating the modified rank
We need to calculate the rank of each candidate within each poll and sample type based on their poll results. However, as we are calculating the modified competition rank we can't use the new rank interface (as it only offers rank, dense rank, and percentile rank) and instead have to type the calculation ourselves:
[Rank]
|
{
PARTITION [End Date], [Poll], [Sample Type] :
{
ORDERBY [Poll Results] DESC:
RANK_MODIFIED()
}
}
|
The partition defines when our ranking restarts. In our case, the rank should restart from every [End Date], [Poll], and [Sample Type].
We use ORDERBY * DESC to define the field we're actually ranking on and whether the field should be in ascending or descending order when we assign the ranks.
Finally, RANK_MODIFIED() lets Tableau know the type of ranking that we're using.
3.2 Extracting the poll results for 1st & 2nd place
In order to calculate the spread between 1st & 2nd place we need to extract these values so we can subtract one from the other. However, in some polls 2nd place is actually joint 3rd, so we need to figure out when this situation has occurred and instead pull in the points for joint 3rd. For this reason we use three LOD calculations instead of two:
[1st Results]
|
[2nd Results]
|
[3rd Results]
|
{ FIXED [Poll], [End Date], [Sample Type] :
MAX(
IF [Rank] = 1
THEN [Poll Results]
ELSE 0
END
)
}
|
{ FIXED [Poll], [End Date], [Sample Type] :
MAX(
IF [Rank] = 2
THEN [Poll Results]
ELSE 0
END
)
}
|
{ FIXED [Poll], [End Date], [Sample Type] :
MAX(
IF [Rank] = 3
THEN [Poll Results]
ELSE 0
END
)
}
|
Here, we fix on [Poll], [End Date], and [Sample Type] as we want to extract 1st, 2nd, & 3rd (if they exist) for each of these combinations.
Inside, we use an IF statement to check whether each row of data has the relevant rank, i.e. 1, 2, or 3. If it is the relevant rank then we consider the [Poll Results], otherwise we return a value of zero. That means the FIXED calculation will only receive the [Poll Results] for the relevant rank.
Finally, we wrap the IF statement inside a MAX() function. This means that for each [Poll], [End Date], & [Sample Type] we extract only the [Poll Results] for the relevant rank and attach this to every row of that data regardless of its rank.
If the value for [2nd Results] is zero it means that 2nd place is actually joint 3rd.
3.3 Calculating the spread between 1st & 2nd place.
Finally, we just need to use a new calculated field which decides whether we have a "joint 3rd" situation or not before subtracting the true 2nd place poll results from the 1st place poll results.
[Spread from 1st to 2nd Place]
|
[1st Results] -
(
IF [2nd Results] = 0
THEN [3rd Results]
ELSE [2nd Results]
END
)
|
After creating this [Spread from 1st to 2nd Place] field we can delete the [1st/2nd/3rd Results] fields and output our data!


