2020: Week 22
For many of the Preppin' Data challenges, we generate randomised data in order to keep the datasets freely shareable. Sometimes this can end up being more challenging than the challenge itself!
If you've ever had to anonymise data so that you can publish a visualisation that you built using sensitive data, or built a dataset to work off of whilst waiting for access to the live data, then I'm sure you can sympathise with how frustrating this can be! You don't want the numbers to be so random that they appear unrealistic, but you also don't want to manually decide upon each value.
Randomising the data at the lowest level of detail is one option, but can result in values varying too drastically when aggregating the data. A growth rate of 56% from one month to the next isn't always very realistic!
This week's challenge is all about the process of generating the data for last week's challenge. It's unlikely you'll get the exact same numbers since we're randomizing the data, but as long as they look sensible, then that's the main goal!
Inputs
Requirements
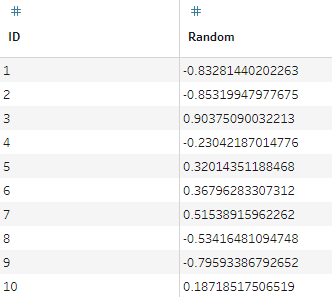
Important: Tableau's Random function doesn't show up when you search for it, but typing Random() into a calculated field works! (Even though it doesn't turn blue). However, I found aggregating these randomised values to be inconsistent and inappropriate for the method I was using. So I have included a list of randomly generated values to use instead.
- You can choose to use the inputs provided or create your own!
- Calculate the Total Market Sales for April.
- Generate the Market Share for March for each Company.
- Remember, summing together all the Market Shares should come to 100%.
- Hint: I found this method useful!
- Hint: To generate a number between a and b the following formula may be useful: Random()*(b-a)+a
- Remember: Market Shares shouldn't be negative!
- The Market Share for April shouldn't fluctuate drastically from month to month. ±0.2% seems sensible.
- I couldn't find a way to do this randomly and still maintain a 100% total, so a cheeky if statement is acceptable here.
- Calculate Sales for each Company for March and April.
- Calculate the Growth for each Company.
- Bring in the Scents for each Company.
- Generate the Growth rate for each Scent in each Company.
- Make sure the growth rates for each scent sum together to equal the growth rate for the whole company.
- Use these growth rates to calculate the difference in Sales from March to April.
- Generate the Sales for March for each Scent in each Company.
- Make sure it sums together to equal the Total Company Sales for March.
- Calculate the Sales for April for each Scent in each Company.
- Output the data with all the Sales figures in one field (see below)
Output

- 4 data fields
- Company
- Soap Scent
- Month
- Sales
- 70 rows (71 including headers)
The full outputs can be found here for comparison. Don’t forget to fill the participation tracker and share your solutions using #PreppinData on Twitter.


