2022: Week 3 The Prep School - Passing Grades
Created by: Carl Allchin
Congratulations, you've made it to Week 3 of our introductory month. Hopefully by now you will know when preparing data there are many ways to create the same output. We love the variety of solutions we see and how to approach the challenges in different tools. Please keep sharing your solutions with us on Twitter, Github, writing blog posts or forums.
This week's challenge will introduce a few new concepts that will become very familiar as you increasing prepare your own data sets:
Aggregation - you've probably used the SUM() and AVG() function in Excel and many different tools but when using tools like Tableau you need to think about data a little differently. You need to think about what each row of data represents. The categorical fields like Student ID and Subject are what set the granularity of the row of data. The more categorical fields your data set has, the more granular your data set is likely to be. When aggregating data when preparing data sets we are often making the data set less granular by removing some of these categorical fields. Click on the Hyperlink at the start of this paragraph to get more background detail if this is a new concept for you.
Joins - Rarely does all the data you want to analyse exist in the same data extract so you may need to combine those different sets of data. This frequently happens through joins. Joins allow you to bolt on additional data fields on to your original data set, enriching it with additional information in the process. Joins can be quite complex but for this challenge we are keeping them simple. Again more information is available through the Hyperlink at the start of this paragraph.
This weeks challenge will allow you to practice both concepts.
The Prep School needs to understand how it's students are performing. The school needs to understand how many students are passing their classes so it can put extra teaching in place if needed. The school is wondering if Gender might be a driver for performance so we'll leave those details in the final data set but anonymise the rest of the data.
Input
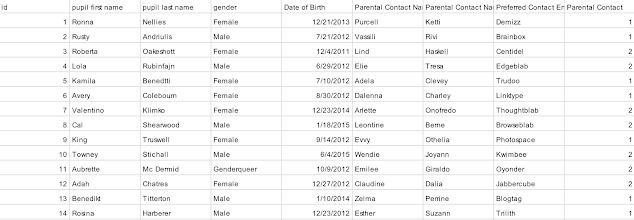

Requirements
- Input both data sets
- Join the data sets together to give us the grades per student
- Remove the parental data fields, they aren't needed for the challenge this week
- Pivot the data to create one row of data per student and subject
- Rename the pivoted fields to Subject and Score
- Create an average score per student based on all of their grades
- Create a field that records whether the student passed each subject
- Pass mark is 75 and above in all subjects
- Aggregate the data per student to count how many subjects each student passed
- Round the average score per student to one decimal place
- Remove any unnecessary fields and output the data
Output

- Passed Subjects
- Student's Avg Score
- Student ID
- Gender


