How to... breakdown Complex Data Preparation Challenges
In previous posts, techniques for determining the alterations required for preparing a dataset for analysis have been discussed albeit at relatively simple level. What about those situations where the challenge isn't straight forward, how to approach the challenge then? This post will cover this exact scenario by taking on one of the most complicated challenges Preppin' Data has covered to date - 2020 Week 3.

The challenge involves taking NBA results and forming the full rankings of Wins vs Loses, Records vs other teams in the same conference and even winning streaks.


The challenge involves taking NBA results and forming the full rankings of Wins vs Loses, Records vs other teams in the same conference and even winning streaks.
Where to begin?
The difference between writing a Tweet and an Essay is a plan (unless you are very serious about your tweets!). The same likeness can be made between a simple piece of data preparation and a challenge that has multiple facets and it may even include some challenges that you are not even sure how you will solve them. Creating a plan in these situations is key as without one, you are likely to go off on tangents or miss the overall objective.
Initial Scoping of the challenge

Here's my initial scope for 2020 Week 3 challenge. Here are a few key elements that are reminders from 'How to... Plan your Prep':
- Map out your inputs - what does each input contain? What dimensions and measures are there in the data? Any data fields that are not in the format you require? What level of
- In this case, only the 'Date' field seems to be something that may need cleaning.
- Map your outputs - How many output files will be required? What format will you need certain fields to be? Think about the granularity of the data required.
- In this case each time will have a single row within the output. This means there will be a lot of aggregation to take the game results to the level required in the output.
- Understand the gaps - what fields do not exist within the data and how are they to be formed? This will create a list of fields that need to be created through either pivoting, joins or calculations.
At this stage, it isn't imperative that you solve all the issues that stand in the way from the input data to the output dataset that will be used for analysis.
Logical Steps
Breaking the challenge down to individual chunks makes the overall challenge a lot easier to workout how best to solve it. Without doing so, the overall challenge may be insurmountable. The formation of calculations you know that you need to resolve are a simple step to take as they will help:
- Guide what steps you need to take to be able to find a solution
- Give an order in which to do things
Let's take 'Wins' as an example in this challenge. As you have individual game results, you need to determine who the winner is. This is easier said than done as for each 'win' there is a loss as well. Therefore, two rows are required for each game, one to record the winner, one the loser. To ensure I capture every team's games, I first use the 'Team List' data source and join all game results on to that. Using two calculations then allows me to form that team's points and the opposition's points:


These calculations can then be assessed for who won or lost the game. The same approach can then be taken for games in which the team played away and the results Unioned together.

This approach can then be repeated to ensure you are tackling each of those calculations in turn. As you determine a solution for each sub-challenge, you may need to change the ordering of the steps, or copy and paste entire sections. This is easily done. By right-clicking on the linking line between two steps, you can delete it and then drag the plus from the 'pre-step' to the 'Add' part of the step you wish to link it to in your flow.

Be ready to iterate
Often only by working with the data will the solution come to fruition as otherwise, it might be difficult to imagine how exactly the data will behave during the transformational steps you are making.
For example, when forming the W, L, Home and Away columns, I knew they would involve similar calculations but wasn't sure which order I would handle them in. These columns represent the total wins, loses and well as record of wins and loses achieved at home and away. Here is the flow of how I approached this task:
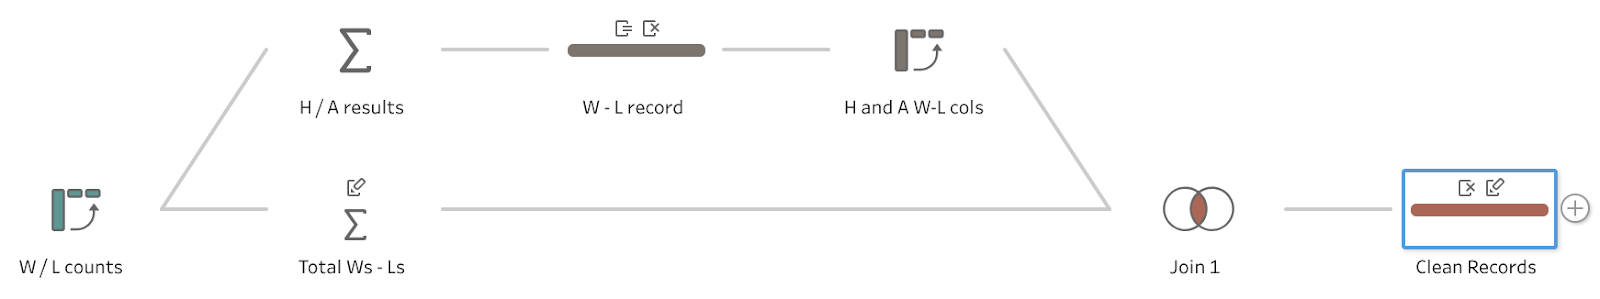
To work through this sub-challenge, the primary data points to form for each team was whether the team won or lost a game. I already had captured whether the team at the focus of the game had scored more points than the opposition. If they had scored more, I had formed a column of 'W' otherwise I returned 'L'. This logic was correct but wasn't ideal for aggregating to create all the relevant totals of Wins or Loses. Therefore, I pivoted this column to create a columns of wins and loses and to make the next counts simple, I had created a simple calculation of 1 to add in to each win or loss column depending on the result.

Knowing that the next steps would require an Aggregation step, I began to recognise the process would need to be split at this point in to two streams. The Aggregation step only returns the aggregated values and the 'Group By' data fields (to understand the Aggregation step in Prep read this 'How to... Aggregate' post). Even with very careful planning, it would be unlikely that I would have thought about taking the step to add an additional branch to the flow at this point. Prep is a fantastic tool for being agile once you prove that your logic has differed from your initial thoughts. As I needed to aggregate at an overall level as well as splitting out Home and Away records, I needed two separate Aggregate steps.

These two flows were eventually Joined back together to form one overall view of the team's records at the end of the flow shown above.
The power of being able to iterate your approach is key in data preparation as often there are cleaning issues you didn't spot in your initial approach or your attempted solution didn't work as intended. Enjoying the challenge of data preparation comes down to being able to focus on problem-solving. This is much easier if you break the challenges down in to more manageable chunks.
____________________________________________________
Test these approaches by trying to solve some of the more complex Preppin' Data challenges:


