How to...Append Data
Joining datasets together is a very common task in data preparation but there is one use of joins that needs highlighting due to it's slightly different use. This technique is called appending. Within Tableau Desktop, appending is often used in Level of Detail calculations - even if you don't know you are doing this.
When analysing data, it isn't always necessary to move data to Desktop to conduct the analysis or answer your questions. Therefore, being able to understand when and how to append data to perform the analysis in Prep can be extremely useful.


When analysing data, it isn't always necessary to move data to Desktop to conduct the analysis or answer your questions. Therefore, being able to understand when and how to append data to perform the analysis in Prep can be extremely useful.
What is Appending?
Appending is the addition of a data field, or fields, on to an existing dataset. This sounds very similar to join but we use the term append when adding a field that contains a constant, or set of constants, rather than a more row-to-row relationship that is found within joins.
Exploring Appending through Level of Detail calculations
As Tableau Prep is designed to prepare data for Tableau Desktop and Server, I am assuming many of the readers of this post will be familiar with Level of Detail calculations. If not, let's have a quick recap:
When to use a Level of Detail calculation
Tableau sets the level of aggregation of a measure by the my granular dimension, or combination of dimensions, used within the view of Tableau Desktop. In the example below, using data from Tableau's sample dataset 'Superstore', a LoD will be used to set the total sales for Category no matter the make-up of view in Desktop so the percentage of sales within each category can be calculated for a sub-category. Here is the view that the Level of Detail calculation will be updating:

The percentage being calculated is the 'Percentage of Total' of the sales across all categories. The Sub-Category percentage of Category Sales could be formed with a Table Calculation but not with how we will eventually use the Percentage of Category sales as Category will not be in the view like so:

How to write a Level of Detail calculation in Desktop
In Tableau Desktop, or when web-editing on Tableau Server, a Level of Detail (LoD) calculation can be written wherever calculations can be entered. A LoD calculation is formed by setting a hierarchical level for which an aggregation will be processed. Therefore, the LoD will ensure the calculation 'Categorical Sales' always determines the total sales for the category that each sub-category is in.

This calculation sets a constant for each Category.

Behind the scenes, Tableau is appending the total sales value on to each Category's values. To finish the example, let's use the appended value in a calculation to determine each Sub-Categories contribution to the percent of categorial sales:

The Categorical Sales will only ever return one value as a sub-category can only be in a single Category. By appending the Categorial Sales value, Tableau allows for the analyst to answer a lot of complex questions, very easily. Prep in the earliest versions didn't have the ability to add LoD calculations but the effect could be created by using the appending technique.
How to Append in Prep?
There are two techniques to append data in Prep depending on whether a Join Condition pre-exists within the data and one technique where it doesn't:
When a matching field exists
For this walkthrough, let's use a simplified version of the Superstore dataset but perform the same analysis as we did above in Desktop, but this time just in Prep using the Appending technique.

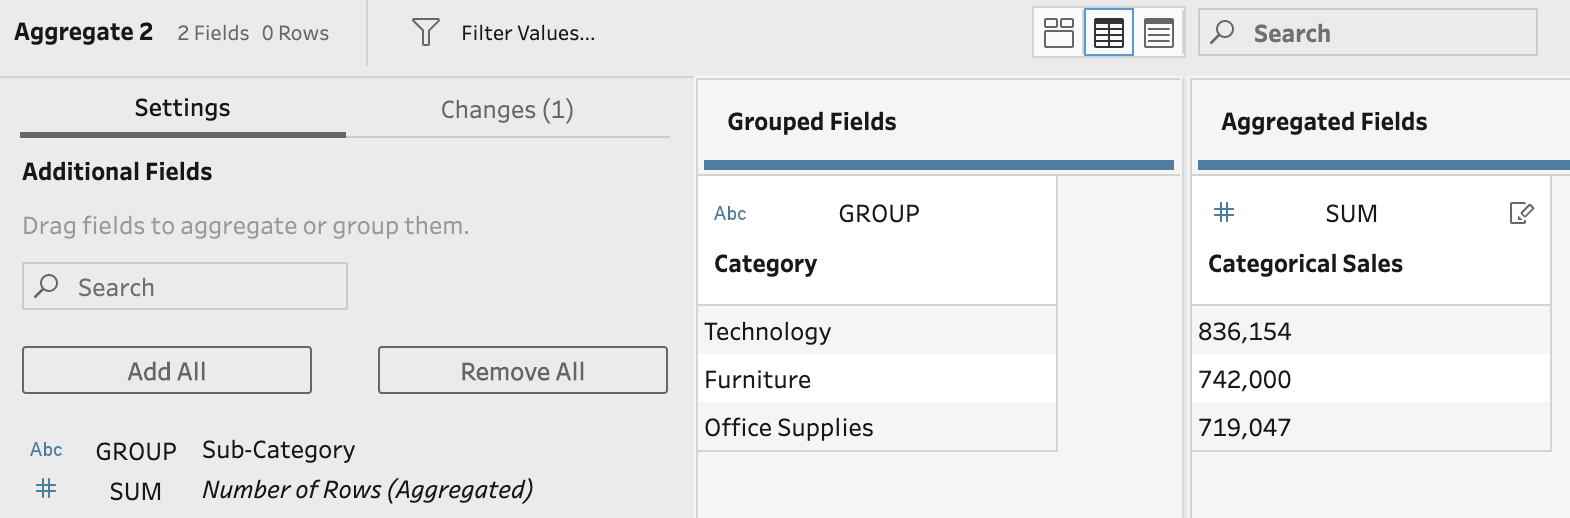
Step 1 - Form the Categorical Sales
Using an Aggregate Step, group by the Category and Sum Sales. This will result in each Category having a single Categorical Sales value. Using an Aggregate Step removes the other data in the dataset.
Step 2 - Join the Aggregated results back on to the Original dataset
By completing a self-join, joining an earlier stage of the data preparation flow to the output of the Aggregation step, the original data at a Sub-Category level, is added back in to the flow.

Using an Inner Join with a Join Condition of Category = Category, then Categorical Sales are added back on to the original dataset. With an Inner Join, you should delete the matching field that will now be called 'Category-1' as Prep won't allow for duplicate field names.

Step 3 - Calculate the Percent of Categorical Sales
The final step is to build the calculation to contain the percentage. This has been rounded to two decimal places to make the values easier to read.

When no matching condition exists
The append technique relies on there being a joining condition, but what if you were summing up the full data set, there would be no value to join on. Finding a total value for the data set means only the Total Value created by the Aggregated Step is returned. Here we can use a technique in the next post also, joining a dummy constant that is added to each side of the join.
The value 1 is an easy, efficient way to do this. Here are the differences in the steps above:
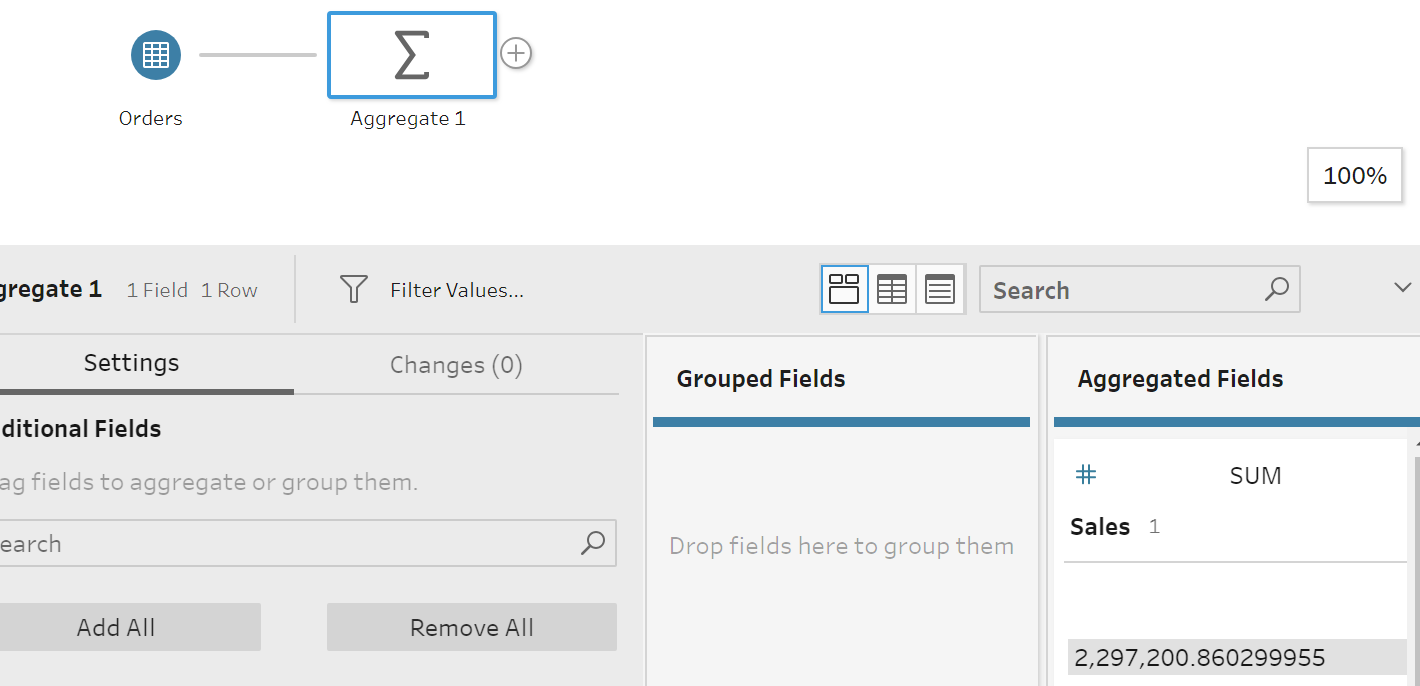
Step 1 - Aggregate the Total Sales
This time, there is no Group By as we are working out the Total Sales value in the dataset.


The '1' fields can now be removed as they are no longer required.
Step 3 - Calculate the Percentage of Total Sales
Similar to before, except this time using the Total Sales value instead of Categorical Sales.

This technique allows the user to form Percentage values at the level of granularity you need for the analysis without having to use Table Calculations or Level of Detail calculations in Desktop.
________________________________________________
If you want to try this technique, try the following weekly challenges:
The append technique relies on there being a joining condition, but what if you were summing up the full data set, there would be no value to join on. Finding a total value for the data set means only the Total Value created by the Aggregated Step is returned. Here we can use a technique in the next post also, joining a dummy constant that is added to each side of the join.
The value 1 is an easy, efficient way to do this. Here are the differences in the steps above:
Step 1 - Aggregate the Total Sales
This time, there is no Group By as we are working out the Total Sales value in the dataset.
Step 1a - Create Join Constant values
This is an additional step to what was needed in the previous technique. The values to append the Total Sales on to the original dataset need to be created both before and after the aggregation.

In the image above, a Clean Step has been created before the Aggregation Step and after the Aggregation Step to both add a copy of the following calculation:
Step 2 - Join the Aggregated Result back on to the Original Dataset
This is the same as the previous version of Step 2, except the Join Condition is using the two '1' fields to going the aggregated result back on to the original dataset. This will happen on each individual row. This is where the Total Sales is Appended.

Step 3 - Calculate the Percentage of Total Sales
Similar to before, except this time using the Total Sales value instead of Categorical Sales.

This technique allows the user to form Percentage values at the level of granularity you need for the analysis without having to use Table Calculations or Level of Detail calculations in Desktop.
________________________________________________
If you want to try this technique, try the following weekly challenges:


