2022: Week 21 - Solution
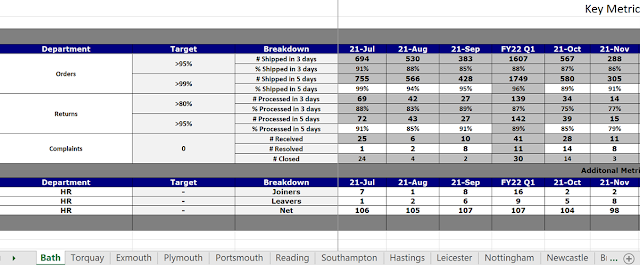
Solution by Tom Prowse and you can download the workflow here . The challenge this week focussed on a real world data structure that needed some cleaning in Tableau Prep so that we could easily visualise the data within Tableau Desktop. There are lots of sheets and some key metrics that we want to focus on... let's see how we completed it! Step 1 - Input Sheets The first task is to input all of the different sheets which are based on the different stores. After connecting to the Input file, we then need to use the Data Interpreter to clean the sheets so the table is easier for us to work with. The Data Interpreter will split the sheets into two tables, Key Metrics and Additional Metrics - we want to just focus on the Key Metrics. As we are using the Data Interpreter, we can't use the Wildcard union, therefore we need to input all of the tables (with A4:T15) in the title, until we have all of the stores in a single table. The workflow will look something like this: As a resul...


