Posts

2019: Week 35

Image
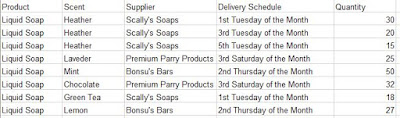
This week's challenge builds on our Supply Chain challenge of last week. Last we created a data set that enabled us to understand how our stock levels were going to recover from their zero position (that's right, we emptied our warehouse). This week we are looking at whether those recovering stock position is going to enable to meet the requests from of our stores of stock top-ups. Using last week's output of stock levels and when they became available (also provided as an input sheet this week)... ...we need to determine which of the Store's requests we can meet. The requests have been captured like this: Requirements Input the data sets Form a running total of our stock levels for each product & scent. Form a running total of the requested quantities for each product & scent.   Compare stock levels to determine: Are any products held in stock not actually needed by any stores? If so, how much surplus stock do we have for these? Which stor...
2019: Week 34

Image
When in Manchester talking about Tableau Prep and Preppin' Data, an attendee asked if we have done anything about Supply Chain data. This week is a significant challenge so you have the attendee and Jack Parry to blame for helping us with this challenge.                              _________________________________________________ Chin & Beard Suds Co has some stock level challenges...basically our inventory is down to nothing as our customers are just loving our products. We need to restock our stores but firstly, we have to deal with our Suppliers. Sadly, our suppliers can only guarantee delivery based on a day of the week and a certain week within the month. This causes us issues as we need to know how much stock we are going to have by certain dates (more on that next week). This week's challenge is to merge together these two datasets to allow us to do analysis in future weeks. We need to unders...

2019: Week 33 Solution

Image
You can view our full solution workflow below and download it here ! Out full solution workflow. Quite a lengthy challenge this week which always means there’s many different paths for the same solution. In explaining our solution, I’ll mark clearly where the flow forks for each of the two outputs. 1. Use a wildcard union to import all the employees. Drag one of the store employee files onto the canvas and change the input option from ‘Single Table’ to ‘ Wildcard Union ’. Set the sheets ‘ Matching Pattern ’ to “* Store” and click ‘ Apply ’. This will bring in and union the other store employee data. Finally, untick ‘File Paths’ in the fields to keep and rename ‘Table Names’ to ‘Store’ as it lets us know which store each employee comes from. Wildcard union settings. 2. Filter out non-2019 employees. On the [End Date] field, select ‘Filter’ and choose ‘Range of Dates’. Choose ‘Minimum’, set the minimum value to “01/01/2019” and tick ‘Include null values’. This will ens...

2019: Week 32 Solution

Image
You can view our full solution workflow below and download it here ! Our full solution workflow. 1. Pivot the products and associated sales. The first step in our workflow is to convert the [Product 1] & [Product 2] fields and the [Sales] & [Sales 1] fields into two fields, [Product] & [Sales], so we have one product and one sales value per row. To do this, we can use a column to rows pivot. First add the two product fields to Pivot1 Values. Then, add a second set of pivot values using the ‘+’ icon underneath the pivot type drop down. Finally, add the two sales fields to the Pivot2 Values area. Take care to align [Sales] with [Product 1] and [Sales 1] with [Product 2] as this ensures they are on the correct rows together Pivoting the Products & Sales into their correct rows. 2. Remove the dashes from the product names. Either in a clean step or in the pivot step we just used, update the new [Product] field by creating a new calculated field with the...

How to... deal with Dates

Image
Sorry to anyone looking for dating advice - this isn't for you. For those who are battling dates in their data sets, then this is for you!  Why are dates important? A basic date field can start to tell us so much: How many sales were made on Saturday? How many students joined the programme this term? How many games does my team play this month? All of this can be formed by counting the number of rows and breaking this down by the different parts of the date. What do we mean by parts of dates? When most of us think of dates we think of days, months and years. Depending on which side of the Atlantic Ocean we are on depends on whether the months or days come first in that order. We are Brits so will unapologetically put days before months for the rest of this post.  The date format we commonly use are dd/MM/yyyy or, for example, 25/09/2019. The 'd' represents the day part and as we have two digits to represent the day then we use 'dd'. 'M' st...

2019: Week 33

Image
Chin & Beard Suds Co management team have heard there is unrest in a few of their Northern stores and asked their HR data manager to pull together some supporting files. Sadly for us, those files are going to take some data prep to ensure we can conduct the analysis we want to.  Leeds Store Staff   Sheffield Store Staff Salary Ranges Store Sales The rumours we've heard are: We are paying people more than our Corporate Pay Ranges that we have agreed Bonuses account for very little (less than 10%) of someone's salary We want your help to answer these questions for us. There are some contractual pay conditions you should consider: Bonus will be paid as long as you are still an employee for at least the 1st day of the final month of the quarter. Consider only employees who received salary during 2019 Anyone paid above the salary range will receive no bonus (we pay them enough already) Assume today's date for the analysis is 1st October 20...

2019: Week 31 Solution

Image
You can view our full solution workflow below and download it here ! Out full solution workflow. 1. General preparation: pivoting statuses. The first stage towards all four outputs is to get all the [Date]s for a single [Order] onto the same row, giving each [Date] the appropriate [Status] field name. To achieve this, simply use a Row-to-Columns pivot. Put [Status] onto ‘Pivoted Fields’, and put the MIN or MAX of [Date] onto the aggregation section We can take MIN or MAX as there is only one [Date] per [Status] per [Order], so MIN & MAX are one and the same. Pivoting the statuses. 2. Get preparation: getting the time between dates. The second stage of general preparation is to calculate the [Time to Send] and the [Time to Review from Sending Order]. To calculate these we can use the DATEDIFF() function to get the days between [Purchased], [Sent], and [Reviewed] [Time to Send] [Time to Review from Sending Order] DATEDIFF('da...